Blender render farm pricing
By Superluminal Engineering
Superluminal bills the measured render time of each finished frame. Twelve benchmark jobs cost $0.14 to $1.90 each.
Published 2026-07-29 · Updated 2026-08-06
- Billed work
- Finished frame task
- Task charge
- runtime × GPUs on node × current rate
- Not billed
- Queueing, failed or canceled attempts, and delivery
- Twelve measured jobs
- $9.56 total
A frame task adds a charge only after it finishes.
Runtime is converted from seconds to hours.
Finished frames from before cancellation remain billed.
The reconciled charges ranged from $0.14 to $1.90.
Superluminal charges the measured render time of each finished frame. Queue time, startup, downloads, failed tasks, and canceled tasks add no charge.
Frames that finish before a cancellation remain billed.
Choose capacity in GPUs and nodes
The capacity control selects the total GPU count. It also lets you place one, two, or three GPUs on each node.
The control shows the current rate for the selected GPU count. More GPUs can finish independent frames sooner, but the per-GPU rate also rises.
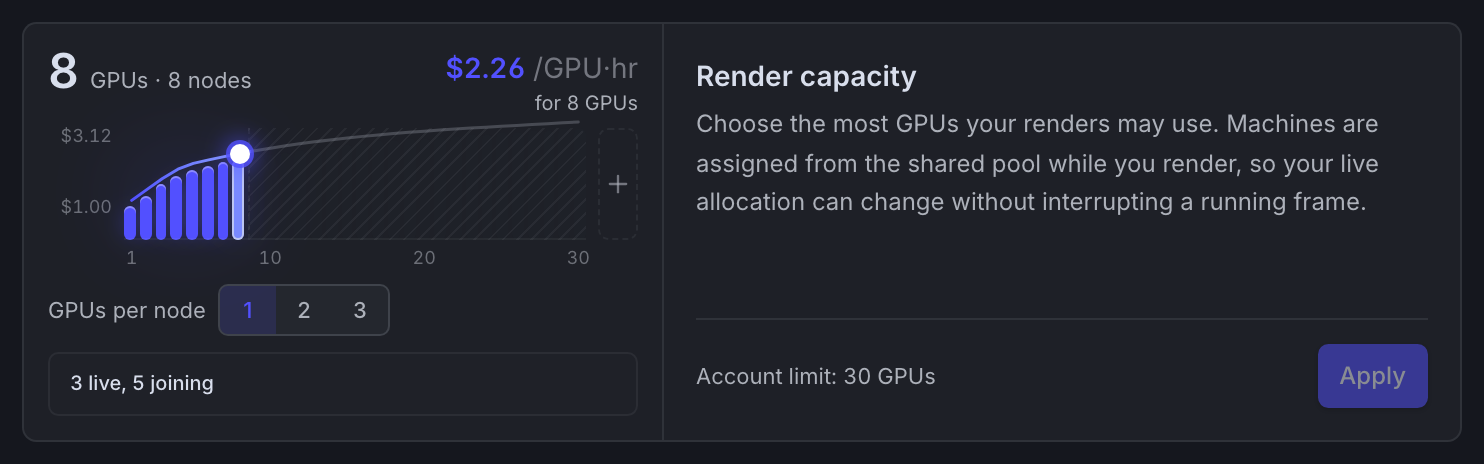
The live rate table supplies current prices, and the dated rate dataset records the curve below.
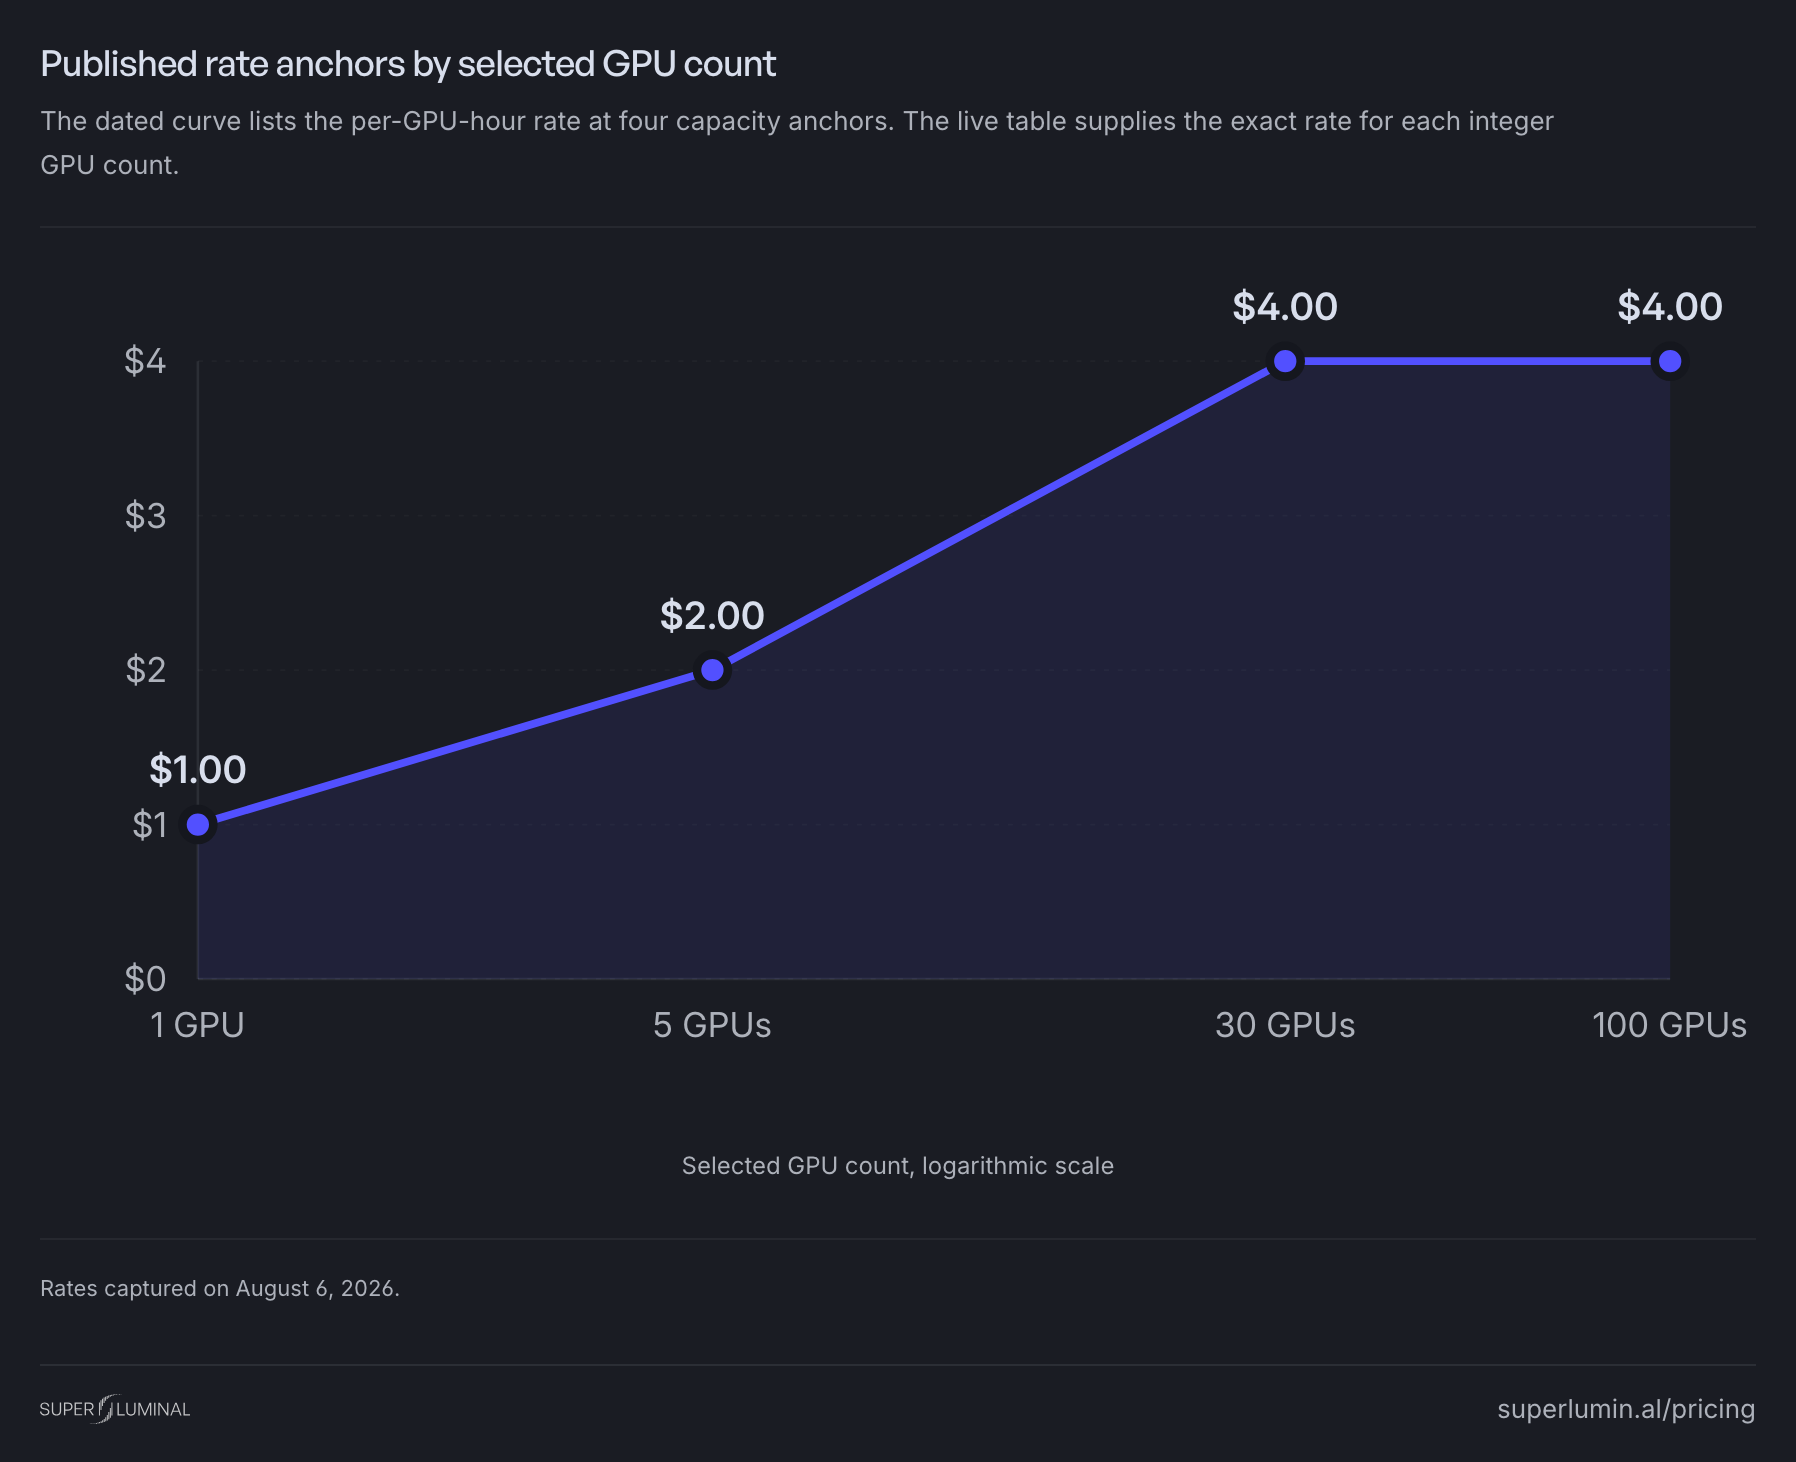
Published rate anchors by selected GPU count
The dated curve lists the per-GPU-hour rate at four capacity anchors. The live table supplies the exact rate for each integer GPU count.
The billing guide explains the same control in the web app. The calculator lets you test any count from one to 30 nodes.
Calculate one frame charge
Each finished frame adds this charge:
$ \text{frame charge}=\frac{\text{render seconds}}{3600}\times\text{GPUs on the node}\times\text{rate per GPU-hour} $
The rate comes from the total GPU capacity active for your organization. Billing uses the successful frame runtime measured on the farm.
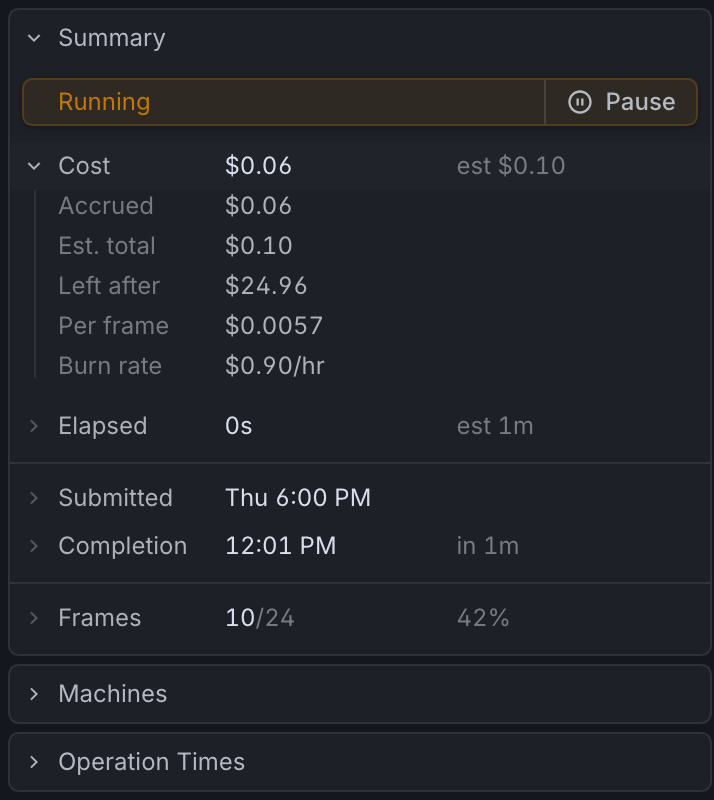
The job page updates the charge as frames finish. See job details for the live cost and compute fields.
Measured prices at three capacities
The benchmark rendered four scenes at five, ten, and 30 selected nodes. These are the exact job charges shown by Superluminal.
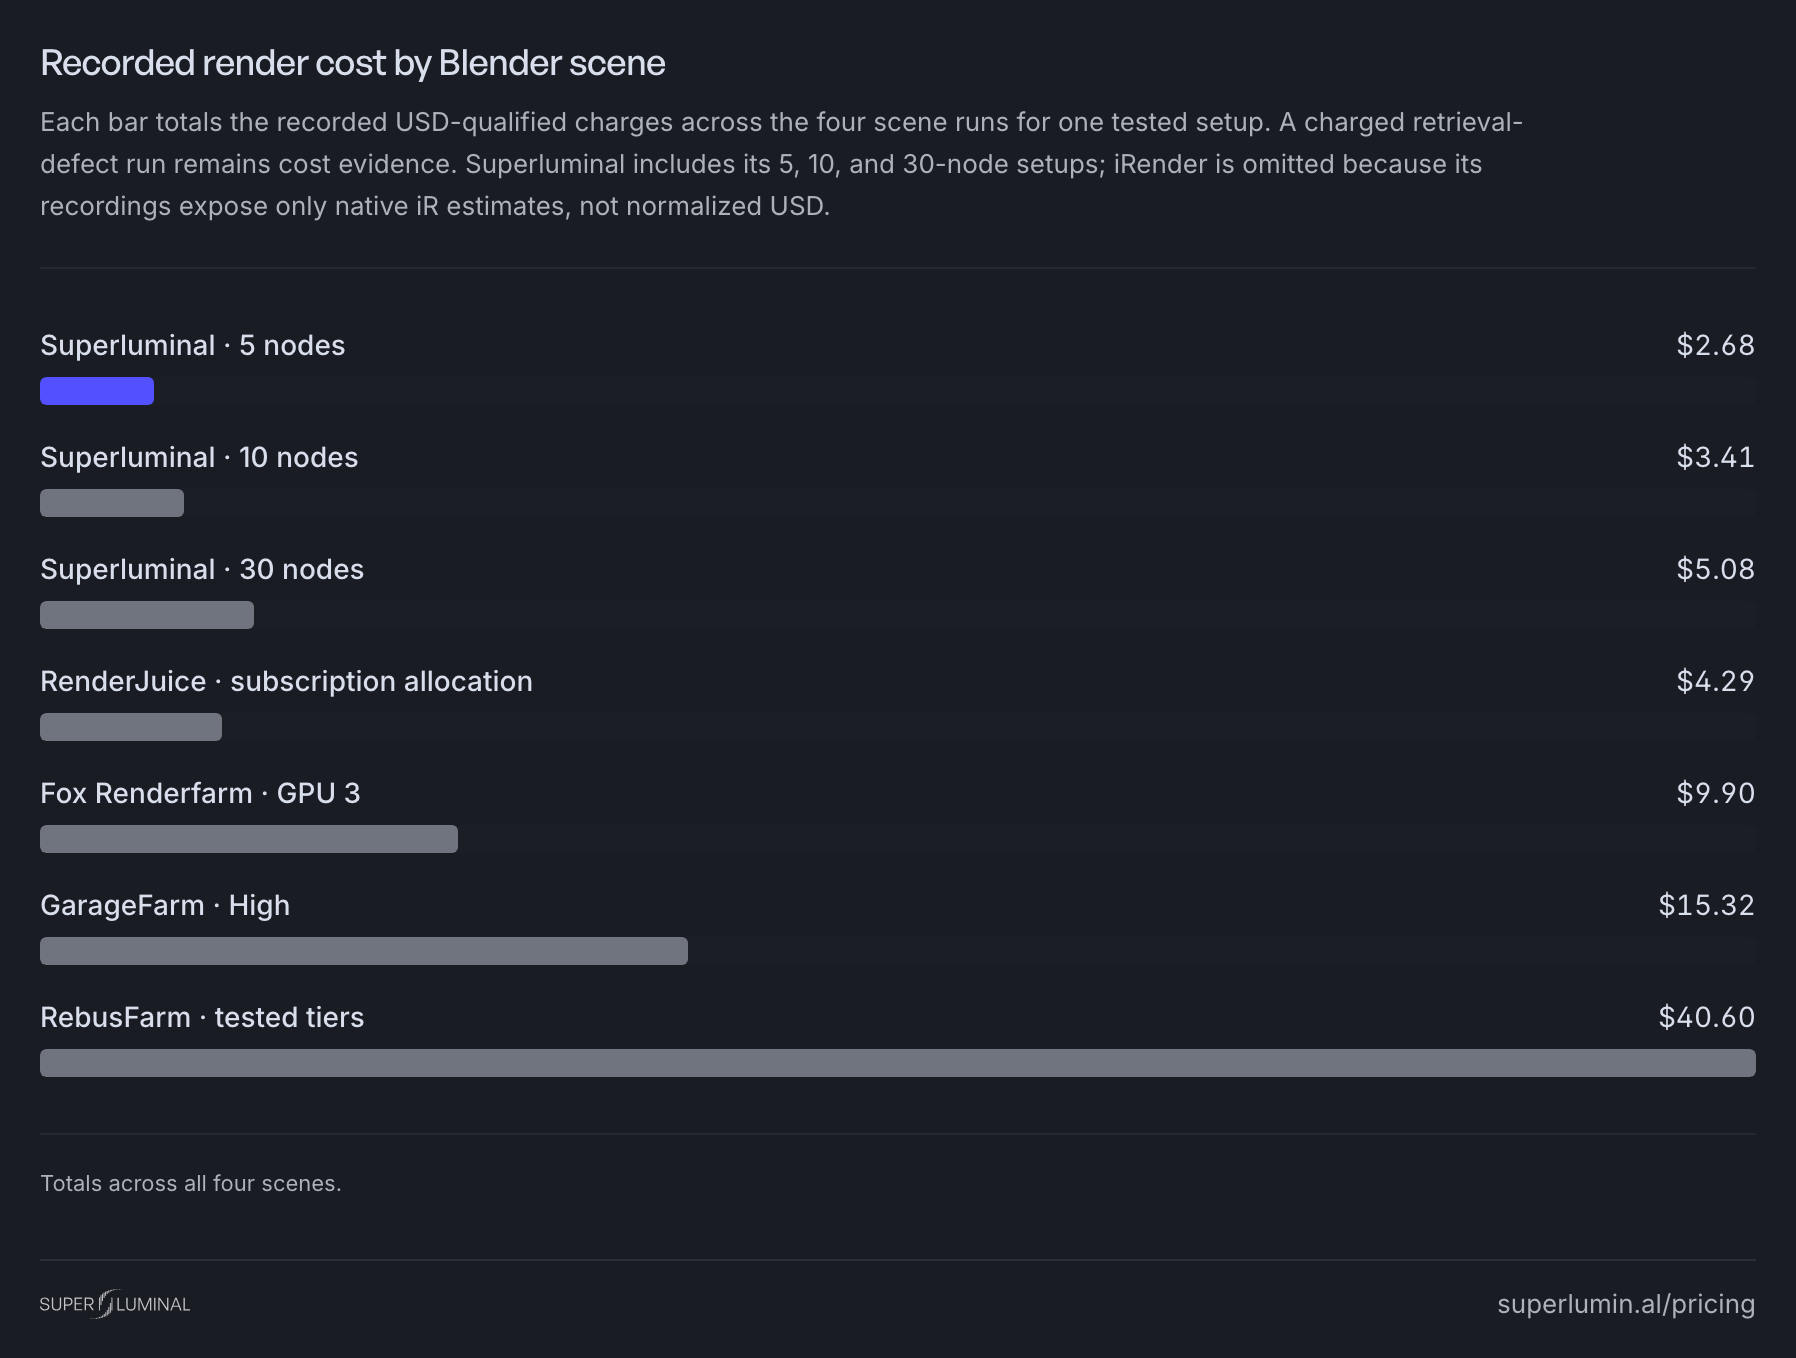
Recorded render cost by Blender scene
Each bar totals the recorded USD-qualified charges across the four scene runs for one tested setup. A charged retrieval-defect run remains cost evidence. Superluminal includes its 5, 10, and 30-node setups; iRender is omitted because its recordings expose only native iR estimates, not normalized USD.
| Scene | 5 nodes | 10 nodes | 30 nodes |
|---|---|---|---|
 Classroom, 145 Cycles frames Classroom, 145 Cycles frames | $1.10 | $1.35 | $1.90 |
 Junk Shop, 96 Cycles frames Junk Shop, 96 Cycles frames | $0.48 | $0.64 | $1.21 |
 Monster Under the Bed, 96 Cycles frames Monster Under the Bed, 96 Cycles frames | $0.50 | $0.62 | $0.98 |
 Fox, 50 EEVEE frames Fox, 50 EEVEE frames | $0.14 | $0.33 | $0.31 |
| Four-scene total | $2.22 | $2.94 | $4.40 |
Five nodes cost the least for every scene. Thirty nodes had the shortest render pipeline on the three Cycles scenes, and ten nodes were fastest on the Fox scene.
In the render farm benchmark, no tested plan charged less than Superluminal on any scene.
Estimate your animation
Render one representative frame on your machine. Enter its time, your hardware, and the frame count in the Blender render cost calculator.
The estimate uses the selected node count and the same public rate table as the capacity control. Your job page remains the source for the final charge.