Inspect a render job
Use the resizable frame grid, preview, details, scene settings, charts, machines, and logs on a job page.
Updated 2026-08-04
The job page is a resizable workspace. Collapse or resize panels to fit the task.
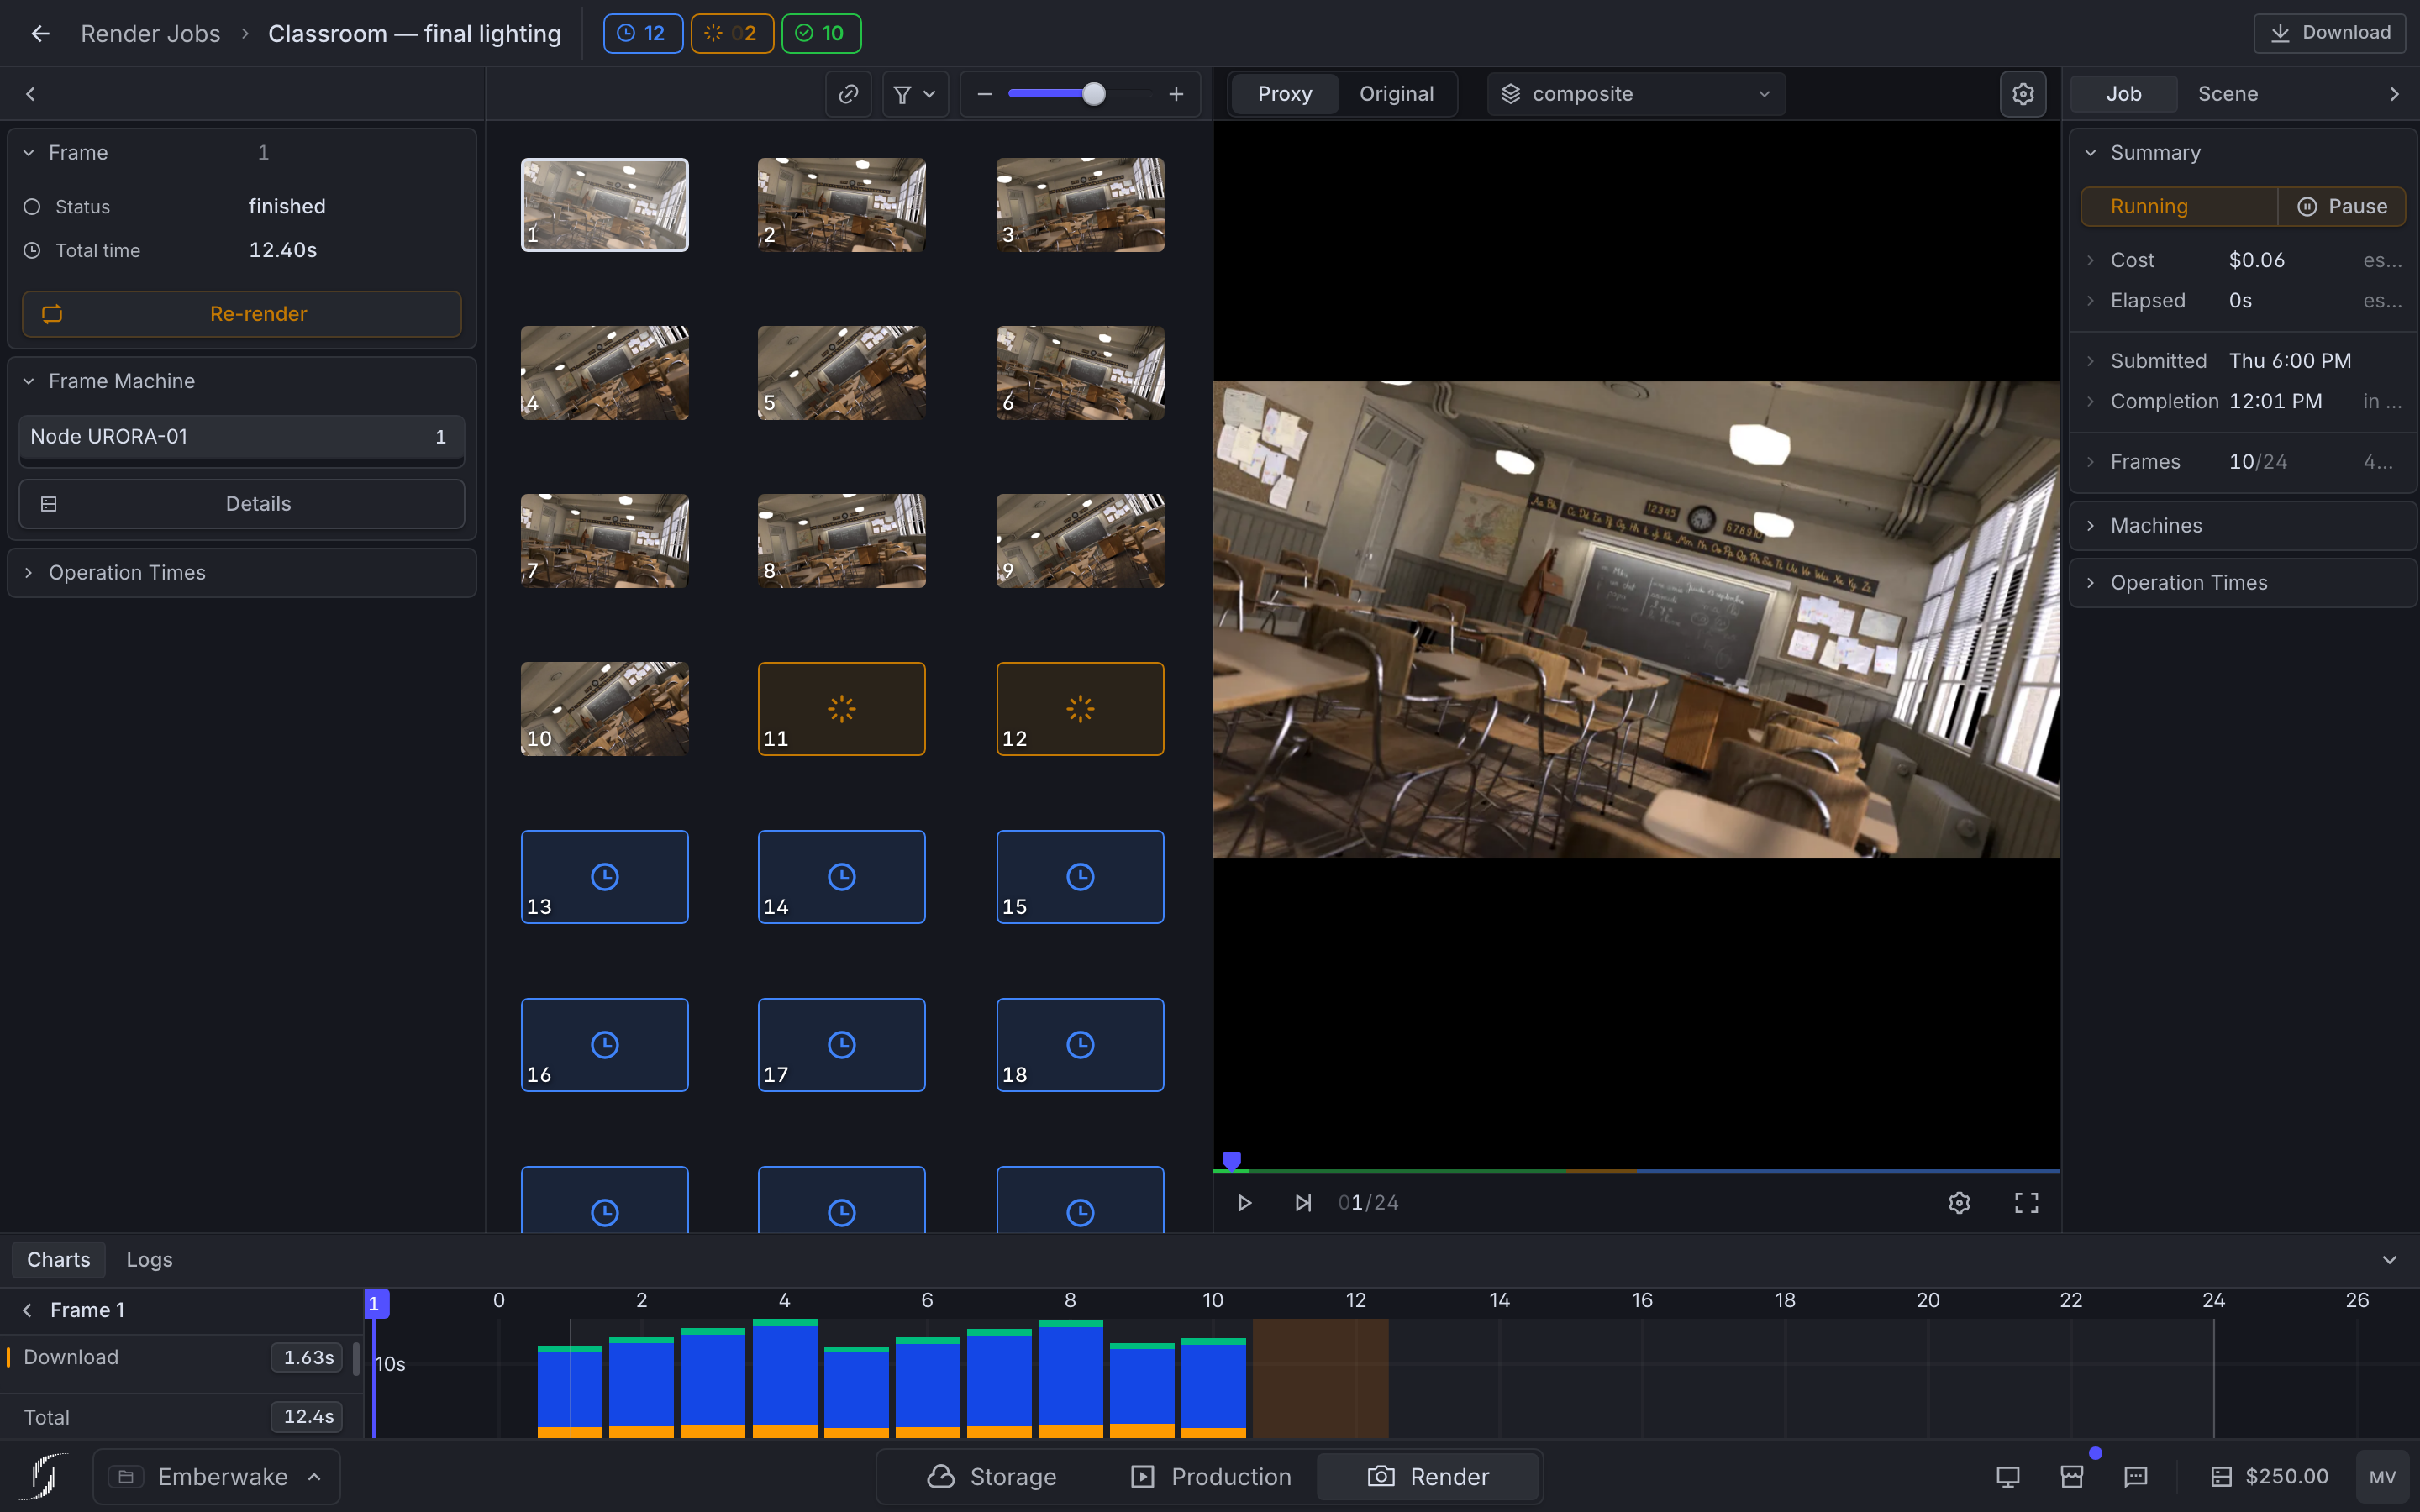
*Resize or collapse panels around the current task.*
Workspace panels
| Panel | Use it for |
|---|---|
| **Frame details** | Inspect one or several selected frames and use actions such as Re-render where available. |
| **Frame grid** | See sequence state, select frames, and navigate the range. |
| **Preview** | Play or scrub the image sequence, zoom/pan, and choose available layers. |
| **Job / Scene details** | Verify job state, progress, estimates, machines, operation timings, and submitted Blender settings. |
| **Charts / Logs** | Inspect the operations chart or read the selected scope's render logs. Per-machine telemetry lives in the Machines card. |
The browser remembers panel sizes and collapsed state. If a panel seems missing, check its collapse control first.
Frame grid and selection
Finished frames show thumbnails, active frames a spinner, and queued frames a clock. Selecting a frame links frame details, preview position, charts, and logs.
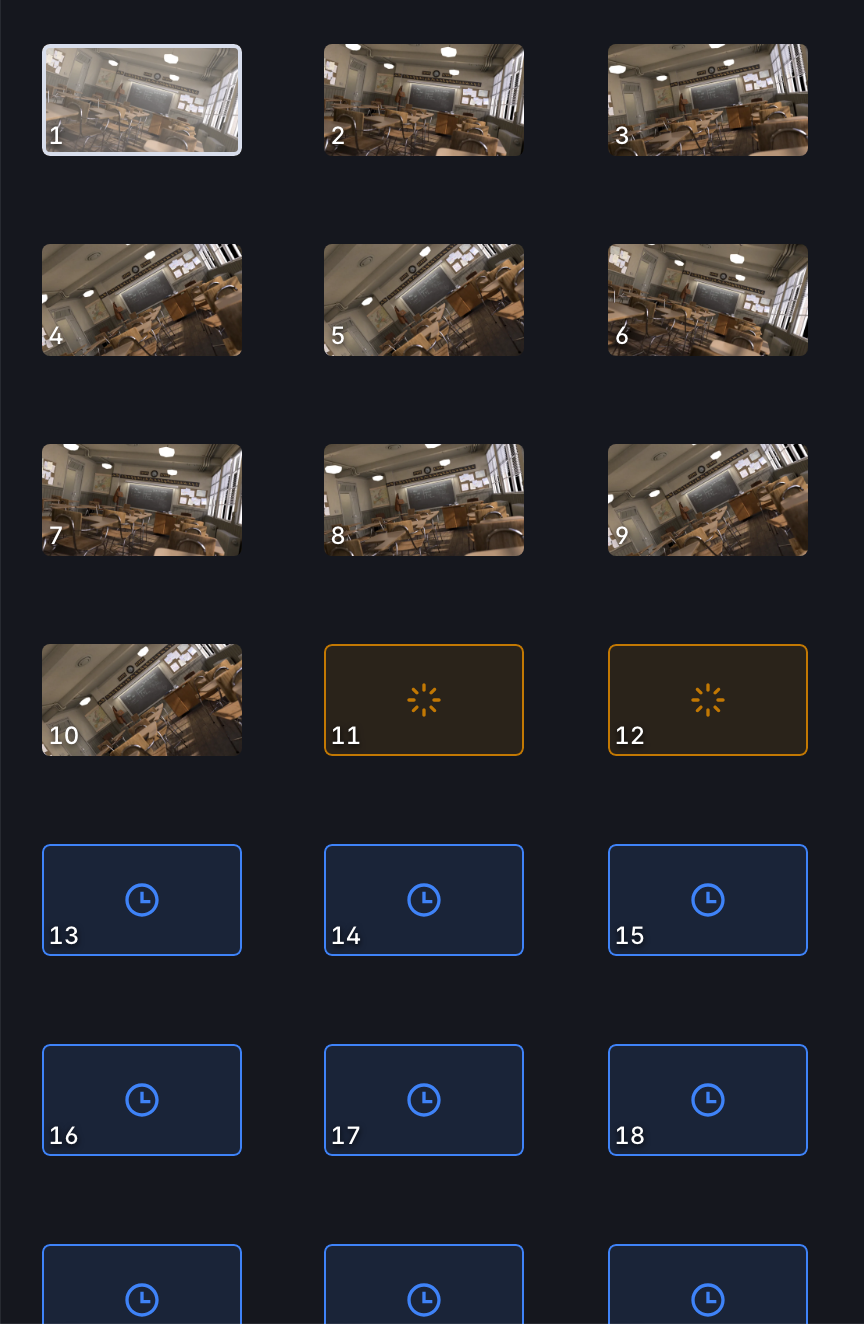
*One glance separates finished, rendering, and queued frames.*
Keys work while focus is outside an input. Navigation follows valid frames in the configured step:
| Key | Action |
|---|---|
Space | Play or pause the preview. |
← / → | Move one frame. |
Shift + ← / → | Move ten frames. |
Home / End | Jump to the first or last valid frame. |
Ctrl/Cmd + A | Select all visible or filtered frames. |
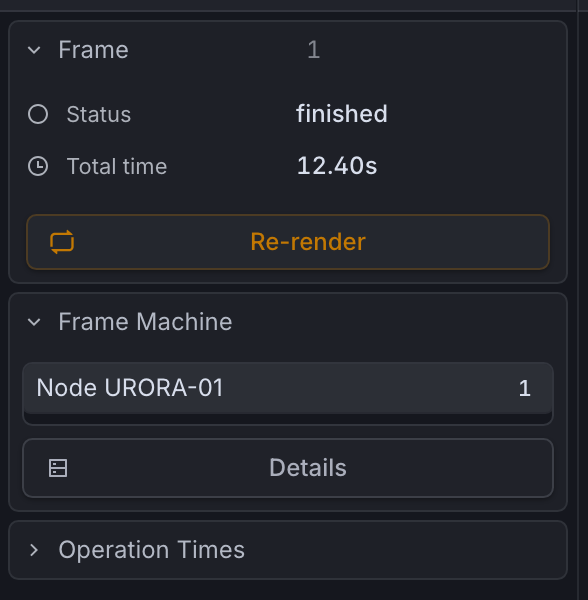
*Selecting a frame fills the left panel with its status, total time, machine, and actions.*
Use Re-render after you understand or fix the issue. An active task can show Cancel and re-render. The frame queues again and can replace existing output. Re-rendering without reading the logs pays for the same failure twice.
Preview
The preview plays and scrubs the sequence. Zoom, pan, and layer selection cover multi-layer or multi-output frames. The timeline and grid can show frames before every optimized preview is ready.
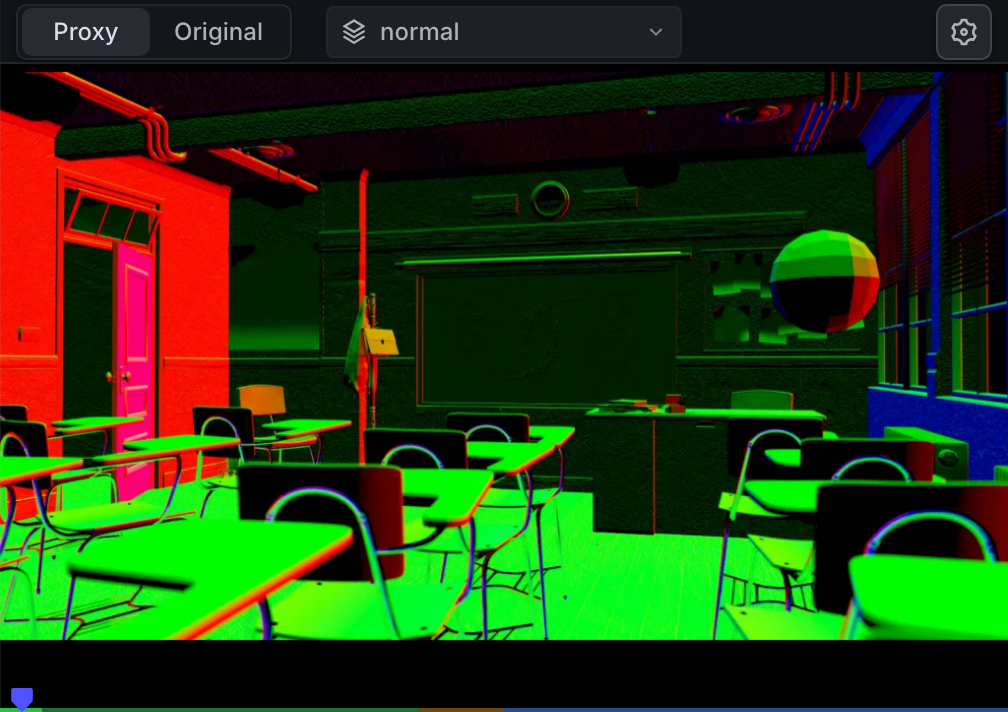
*Choose a render layer without leaving the sequence player. This example shows the Classroom Normal pass.*

*The timeline colors each frame by state. The counter shows the playback position within the range.*
Preview is not original output
Web images are optimized for responsive review. Use Manage & Download in Blender for the full-quality files and validate them before delivery or compositing.
Job and Scene details
The Job tab holds operational job information. The Scene tab holds the submitted scene configuration.
The Summary card
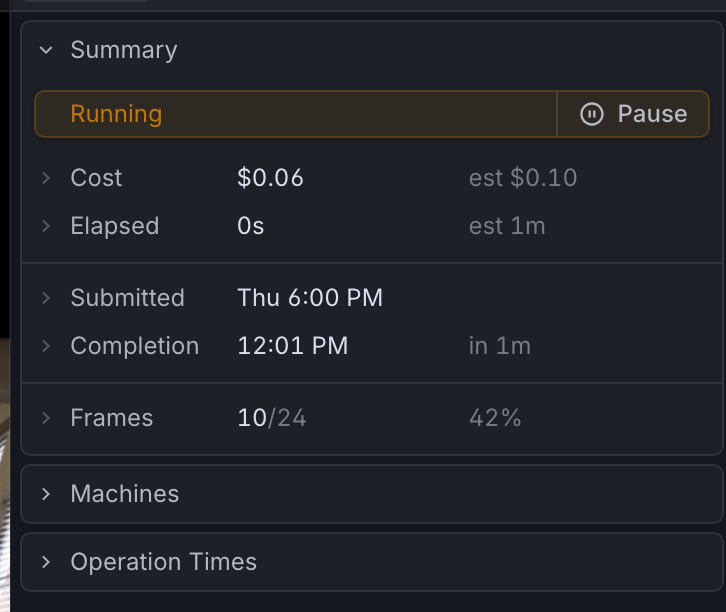
*The Job tab: status with its action, the Summary readouts, and the collapsed Machines and Operation Times cards.*
Each row shows a label, the figure, and a lighter annotation to its right. Annotations starting with est are live projections that refine as frames finish. They are estimates, not commitments.
| Row | Figure | Right annotation |
|---|---|---|
| Status | Queued, Running, Blocked: funds, Paused, Error, or Finished, with the matching action (Pause/Resume) beside it. | |
| Cost | Credits accrued by completed work so far. | est: projected total cost for the whole job. |
| Elapsed | Wall-clock time since rendering started. | est: projected total duration. |
| Submitted | When the job was submitted. | How long ago that was. |
| Completion | The estimated (or actual) finish time. | How far away (or ago) that is. |
| Frames | Finished frames out of the requested total. | Percent complete. |
Click a row to fold open its breakdown.
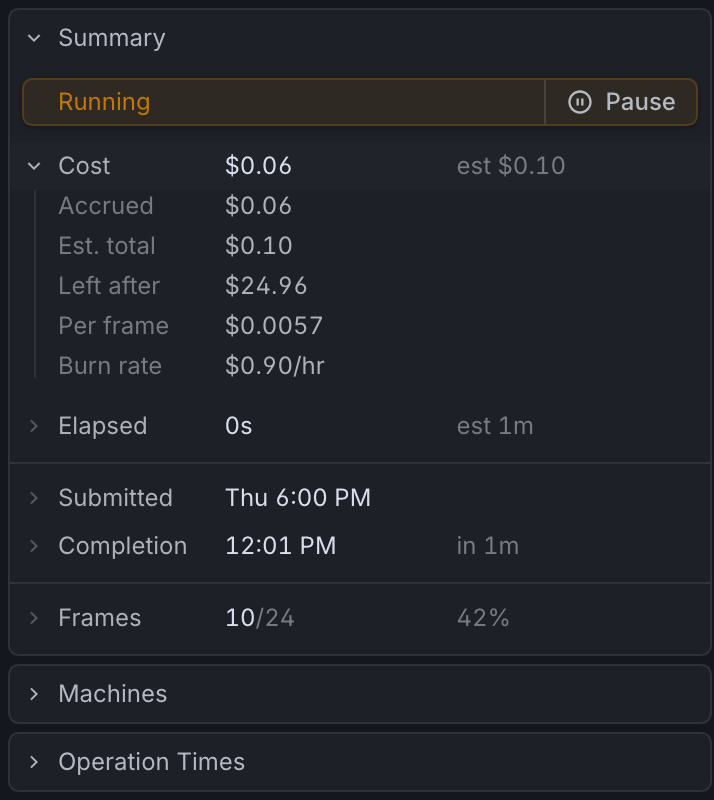
*The Cost row expanded. Each Summary row folds open the same way.*
| Fold | Breakdown |
|---|---|
| Cost | Accrued (spent so far), Est. total, Left after (projected organization balance once the job finishes), Per frame (average cost per finished frame), Burn rate (credits per hour at the current pace). |
| Elapsed | So far, Remaining, Est. total, Compute (summed machine time across all nodes), Parallel (how many machines' worth of work is happening per wall-clock hour). |
| Submitted | Timestamp (full date and time), Age, Queue wait (time between submission and the first frame starting). |
| Completion | Est. finish (or Finished once done), Remaining. |
| Frames | Failed (only when any exist), First, Last, Step, Rate (frames finishing per unit time), Length (the sequence's playback duration). |
Compute versus Elapsed measures parallelism. A job with 10 minutes elapsed and 60 minutes of compute ran roughly six machines wide.
The Scene tab
Scene preserves the submission in Job, Render, Output, and View layer sub-tabs. Check submitted settings there even after the local scene changed.
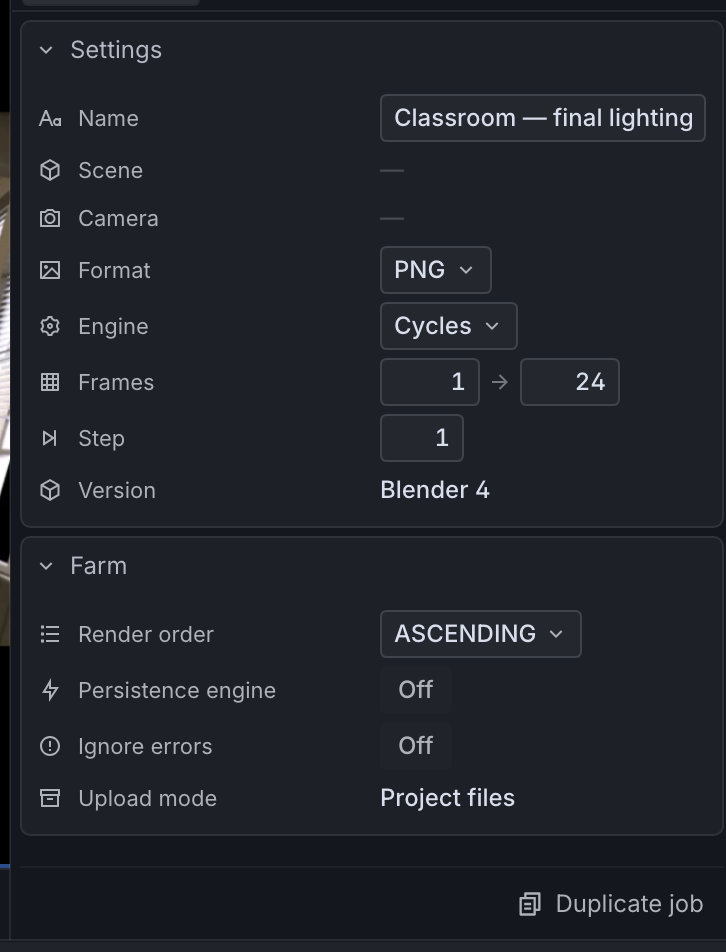
*The Scene tab preserves the submitted configuration: name, format, engine, frames, version, and the farm options, with Duplicate job below.*
Charts and logs
The operations chart compares phase timing across frames. Per-machine GPU, VRAM, CPU, and RAM telemetry lives in the Machines card. Confirm any hypothesis against frame details and logs. Utilization alone does not prove the bottleneck.
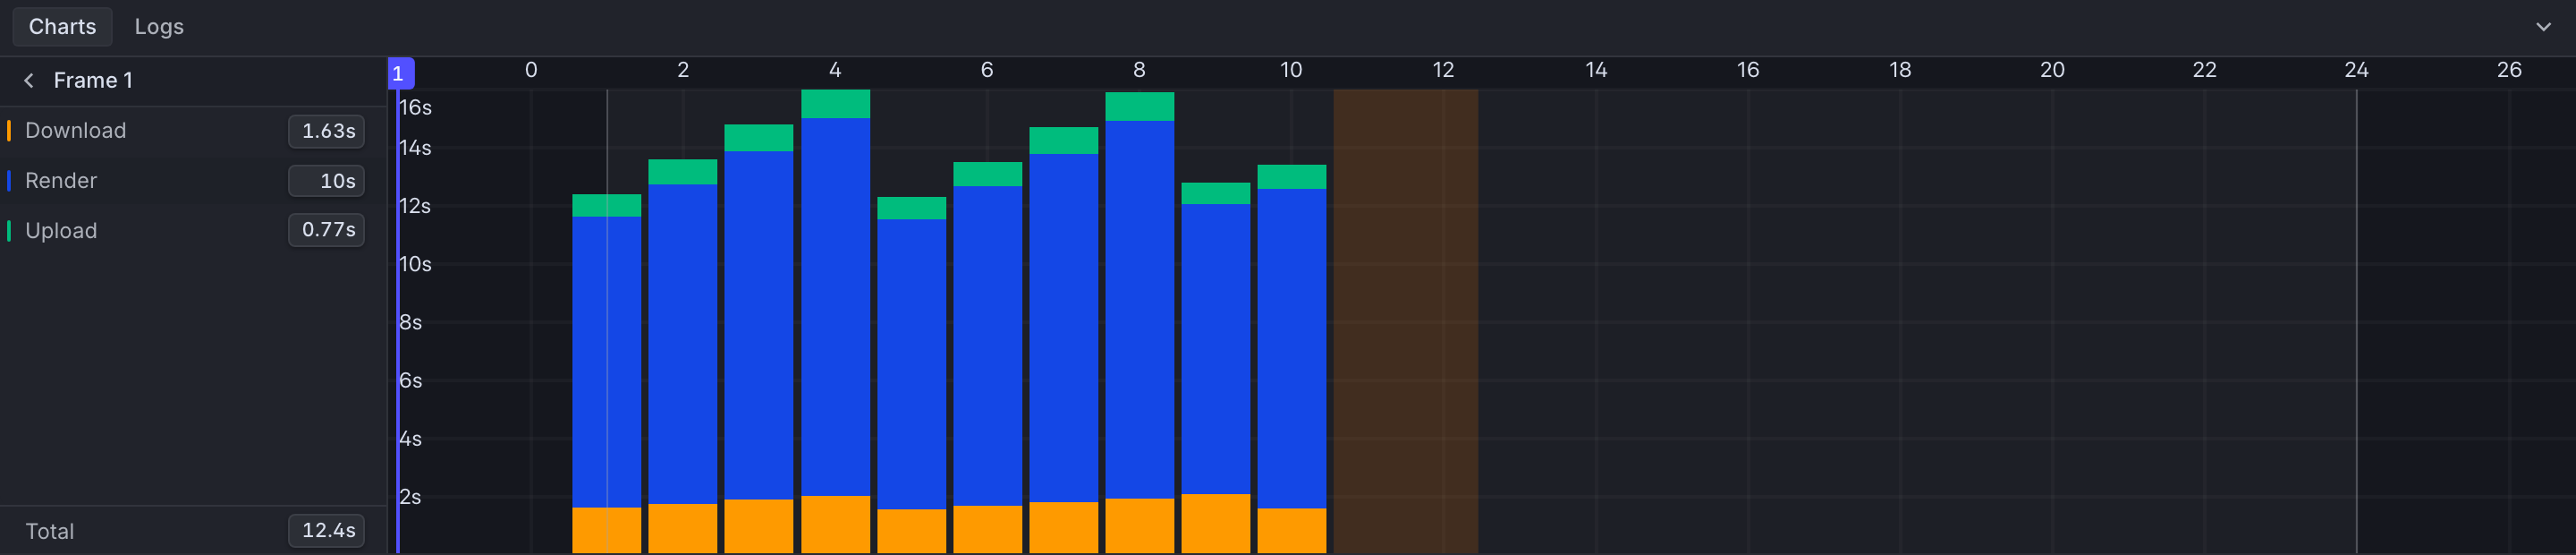
*Each bar stacks a frame's download, render, and upload time. Select a frame to read its exact numbers on the left.*
Switch the panel to Logs for the selected scope's render output.
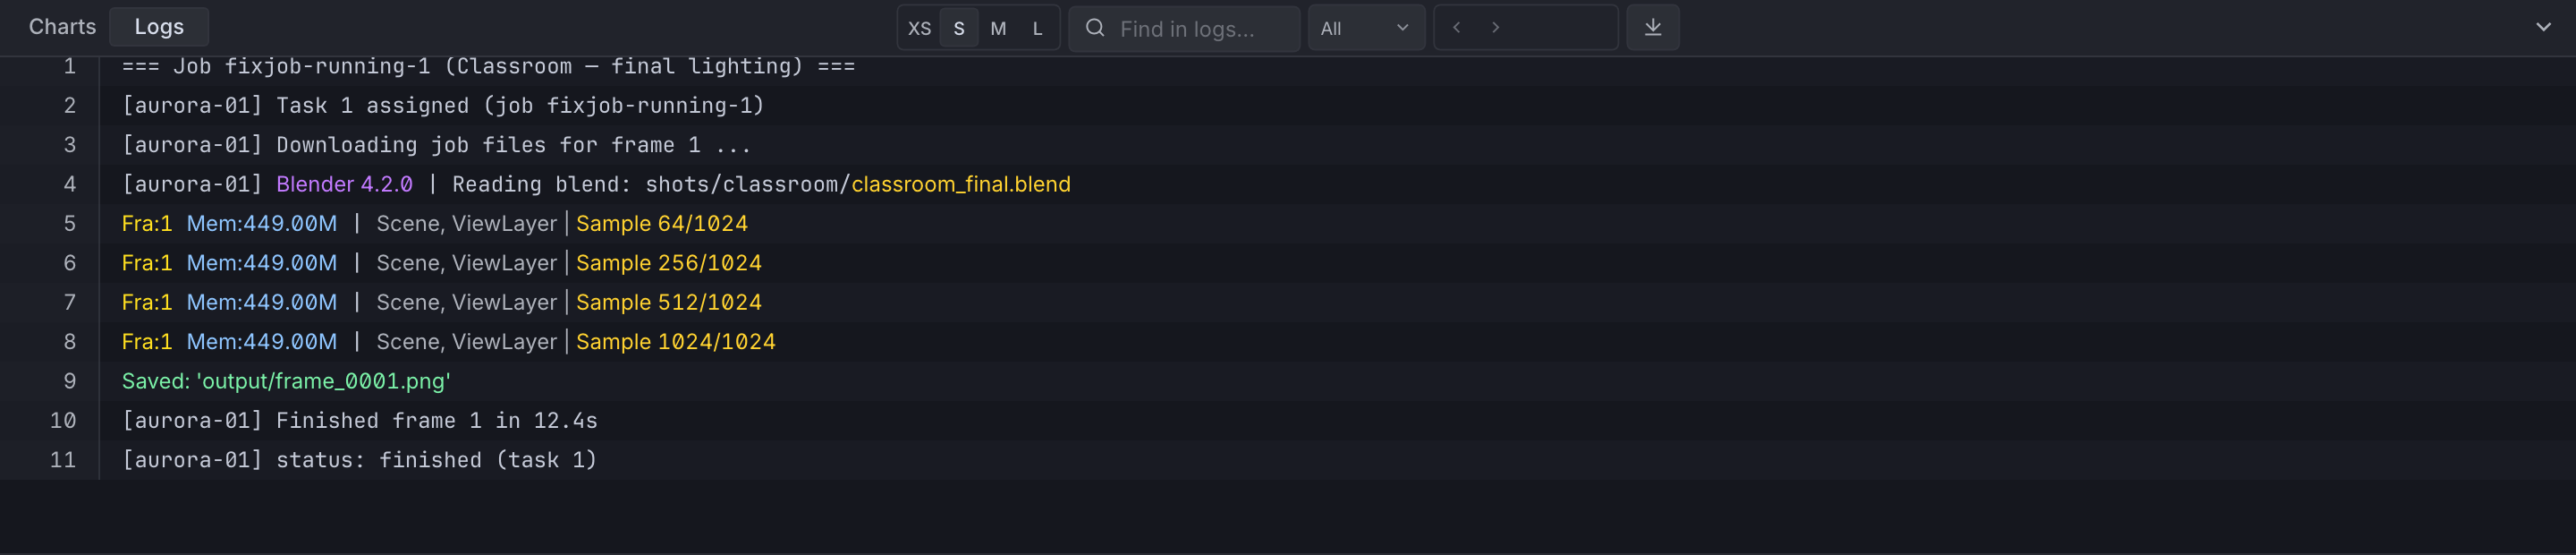
*Search with match navigation, a minimum-severity filter, text sizes, and log download live in the panel header.*
The log view supports:
XS,S,M, andLtext sizes- text search and previous/next match navigation
- severity filtering
- log download for offline review or support
Select the exact failed frame before diagnosing a frame-specific error. When event order matters, send a downloaded log, not a cropped screenshot.
Machines and timings
Expand the Machines card in the details panel for per-machine telemetry, parallelism, and which frames ran where.
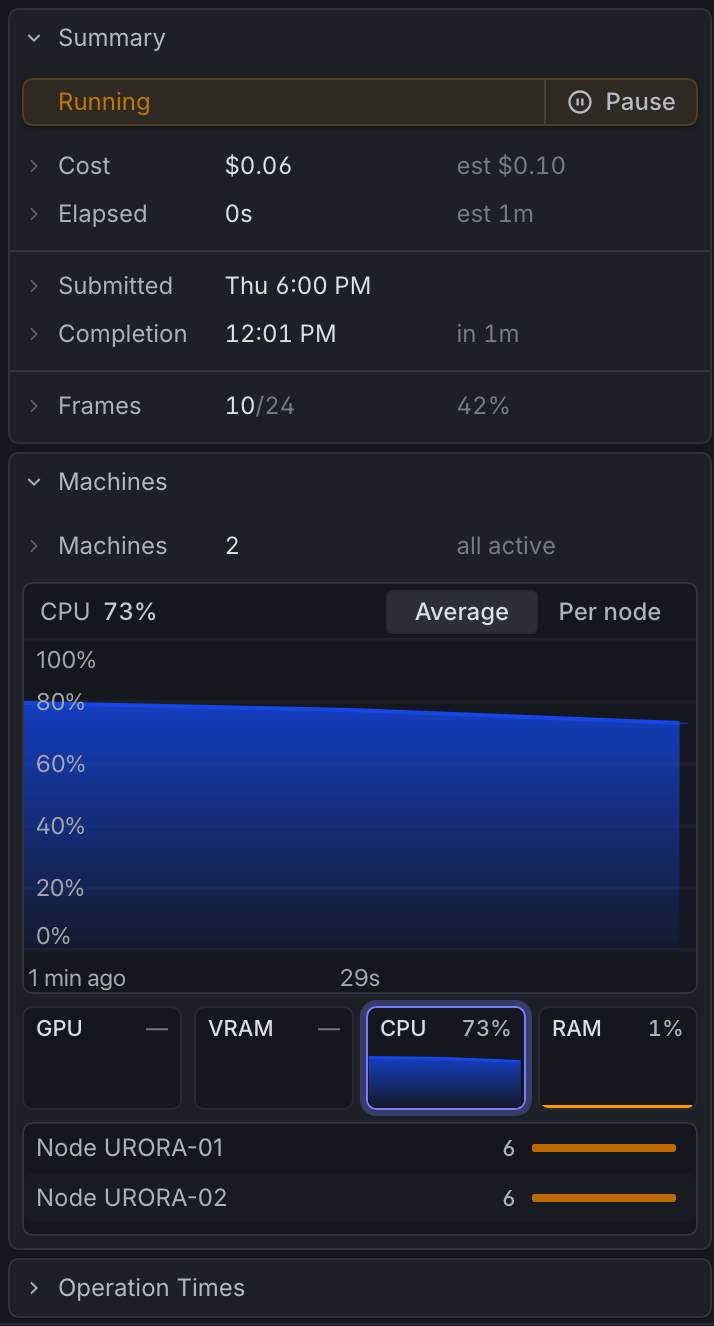
*The Machines card expanded: live utilization with Average or Per node views, the metric tiles, and each machine's frame tally.*
Reading the card:
- The Machines row counts nodes assigned to the job, with their aggregate state (for example all active). Its fold breaks down Compute (summed machine time), Est. total, and Active now.
- The chart plots the selected metric over the recent window. Average blends all machines into one line. Per node draws each machine so one struggling node stands out.
- The metric tiles switch the chart between GPU (compute utilization), VRAM, CPU, and RAM, each with its current reading and a spark of recent history.
- The machine list shows each node's completed-frame count and activity bar. Selecting a machine opens its spec plate: current frame and operation, Last seen, Uptime, Send errors, its frame Range on this job, Time on job, per-frame Fastest, Slowest, and Job average, and its Download, Upload, and Render only splits.
Operation Times
The Operation Times card shows where the job's machine time went, one row per operation (project download, render, thumbnail generation, output upload). Each row folds into Avg per frame, Cost, and % of total, above a Total row. The operations chart compares phases *across frames*. This card sums them *across the job*.
The first frame on a machine can include project download and startup work later frames avoid. Compare similar frames, and keep these measures apart:
- wall-clock elapsed time
- aggregate machine time
- render time
- the surrounding download, scene-build, thumbnail, and upload operations
Download original output
The web app does not download full output. The job header points to Blender instead: open Render Properties → Superluminal Render → Manage & Download, select the job, and choose Download job output.
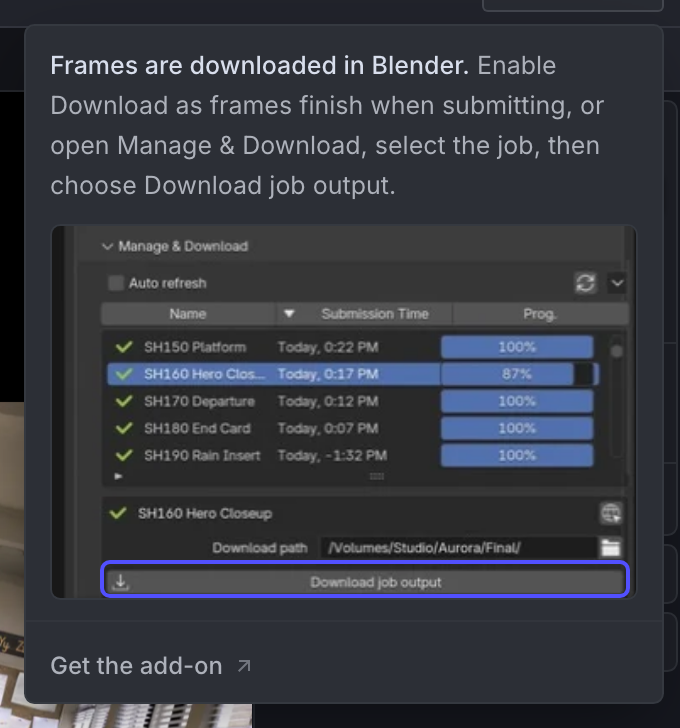
*The header's Download chip explains the flow and marks the exact button in the add-on.*
- Output guide: Plan download, validation, and retention for original frames.
- Manage & Download: Run a resumable job-output transfer from Blender.
- Troubleshoot frames: Turn logs and exact-frame reproduction into a focused fix.