The best Blender render farms, ranked
By Superluminal Engineering
Four animated Blender scenes, 9 services, and one question: which farm saves the most time for the least money?
Published 2026-07-29 · Updated 2026-08-08
Download the customized Blender benchmark scenes
These are the exact packaged .blend scene archives submitted during the benchmark.
| Scene | Engine and frames | Size | SHA-256 |
|---|---|---|---|
| Classroom | Cycles · 145 frames | 67891374 bytes | c2be6e5c1cbcc0ebdb950ccdf3c7090c85e296d3cf94a356e68667f82adb1ead |
| Junk Shop | Cycles · 96 frames | 344330533 bytes | 4f3cac212b9a1bcdae6fed67b128fe1cb1e4b25091d9c8c157e2b2babcf30d68 |
| Monster Under the Bed | Cycles · 96 frames | 75774911 bytes | e310ee769b0efb7790be44dbdd6efcad12db11ea66e48c2dbbaf19456f646b24 |
| Fox | EEVEE · 50 frames | 94472994 bytes | ee80ac93129806326a81e561192a4a6dee513d91eee1536230af6d119bcc1aa8 |
Rankings at a glance
Superluminal ranks first with a combined score of 182.0. Finished and verified every one of its 12 runs on local disk. Charges ran from $0.14 to $1.90, totaling $9.56.
| Rank | Render farm | Combined score | Key result |
|---|---|---|---|
| 1 | Superluminal | 182.0 | Fastest managed-farm runs and lowest exact charges |
| 2 | GarageFarm | 126.2 | Strong all-round runner-up |
| 3 | RenderJuice | 121.2 | Best subscription workflow |
| 4 | RebusFarm | 88.0 | Established multi-DCC pipeline |
| 5 | RenderStreet | 86.5 | Browser workflow with live sequence playback |
| 6 | Fox Renderfarm | 83.5 | Large capacity, slower deliveries |
| 7 | iRender | 56.4 | Full remote-machine control |
| 8 | Render Network | 45.7 | Distributed GPU network |
| 9 | Blendergrid | 42.1 | A displayed dollar quote before submission |
- First delivery to disk
- Superluminal, 4 of 4 scenes
- Shortest managed-farm render pipeline
- Superluminal, 4 of 4 scenes
- Cheapest exact-dollar charges
- Superluminal in every scene
- Dataset
- 43 recorded runs
- Largest failure charge
- 106.85 RNDR credits
- Blendergrid coverage
- 3 of 4 scenes
Frames downloaded during rendering. The last local file arrived 4.1 to 150.9 seconds after provider completion.
The fastest Superluminal render pipeline led the next managed farm by 73.1 seconds on Classroom, 62.8 seconds on Junk Shop, 28.6 seconds on Monster, 47.5 seconds on Fox (EEVEE).
$0.14 to $1.90 per verified job. All 12 Superluminal runs together cost $9.56.
Published as machine-readable evidence with native-unit charges, exact phase boundaries, and per-run outcomes.
Render Network's canceled Junk Shop retry, charged with zero usable frames delivered.
Classroom, Junk Shop, and Monster completed. The Fox scene is missing. The three prices are displayed quotes, not final debits.
We tested nine commercial Blender render services with four standard scenes and screen-recorded all 43 runs.
Method
We packaged four Blender Foundation demo scenes once and submitted them unchanged to every service, on a normal paid account. The demo files ship as stills, so we modified each scene to render a short animation. Most services ran once per scene.
We picked the most balanced GPU configuration each farm offered and moved up a priority tier when that proved too slow.
| Render farm | Configuration tested | Billing observed at checkout |
|---|---|---|
| Superluminal | Capacity selected by node count: 5, 10, and 30 nodes | Exact reconciled dollars per job. Every charge in these tests was between $0.14 and $1.90. |
| GarageFarm | High priority, advertised cap of 60 nodes | Prepaid balance billed at $0.012 per OctaneBench-hour. The final charge is shown in dollars. |
| RenderJuice | Hobbyist plan at Blazing priority | $49/month subscription. Jobs draw from a quota of 2,000 GPU minutes. |
| Fox Renderfarm | GPU 3 | Prepaid balance. Job charges are deducted in exact dollars. |
| RebusFarm | Priority+3 and Standard tiers | RenderPoints. Every tier displayed a rate about 17 percent above its configured rate, and dollars come from a dated purchase of 15 RP for $17.63. |
| iRender | GPU Server 5S, one workstation with four RTX 4090s | Machine rental at 30 iR per machine-hour, pay as you go. Funding starts at a $50 deposit. |
| RenderStreet | On Demand GPU with Optix, plus one supplemental One CPU test | On Demand produced exact job charges. One costs $59.97 per month and has no allocated job cost. |
| Render Network | Tier 2 Priority, the highest tier a normal account can select | RENDER credits at the provider's $1 face value. The meter keeps charging on failed attempts. |
| Blendergrid | Fixed quotes against the shortest offered deadline: two hours | Displayed quotes of $11.73 for Classroom, $7.30 for Junk Shop, and $4.10 for Monster. The recordings show no final debit or invoice. |
The farms forced two deviations. RebusFarm's Standard GPU tier would not start on Classroom, so Classroom and Junk Shop ran on Priority+3. Fox Renderfarm requires the render device set to none for EEVEE.
Every time in this article is the render pipeline unless a section names another clock. It starts when the farm begins working on the job and stops when the farm reports the render finished. For most farms that start is the end of the upload. When a farm requires a separate launch action, the clock starts at that press.
Everything the farm does in between counts against it: analysis, loading, test frames, queueing, rendering, retries, and finalization. Your upload, your download, and time spent waiting on us do not.
iRender is the exception. You rent the machine rather than send it a job, so its meter runs from boot to shutdown and its time covers the whole paid window.
Upload, download, and end-to-end times have their own sections and tables. Charges stay in native units and become dollars only through dated checkout quotes, marked as estimates. Failed attempts keep their cost.
| Scene | Frames | Engine | Shortest render pipeline |
|---|---|---|---|
 Classroom Classroom | 145 | Cycles | Superluminal, 90.5 s |
 Junk Shop Junk Shop | 96 | Cycles | Superluminal, 64.5 s |
 Monster Under the Bed Monster Under the Bed | 96 | Cycles | Superluminal, 59.9 s |
 Fox Fox | 50 | EEVEE | Superluminal, 66.5 s |
Run recordings
Every benchmark run has a dedicated watch page, retained 10× MP4, poster, and structured evidence record.
Results
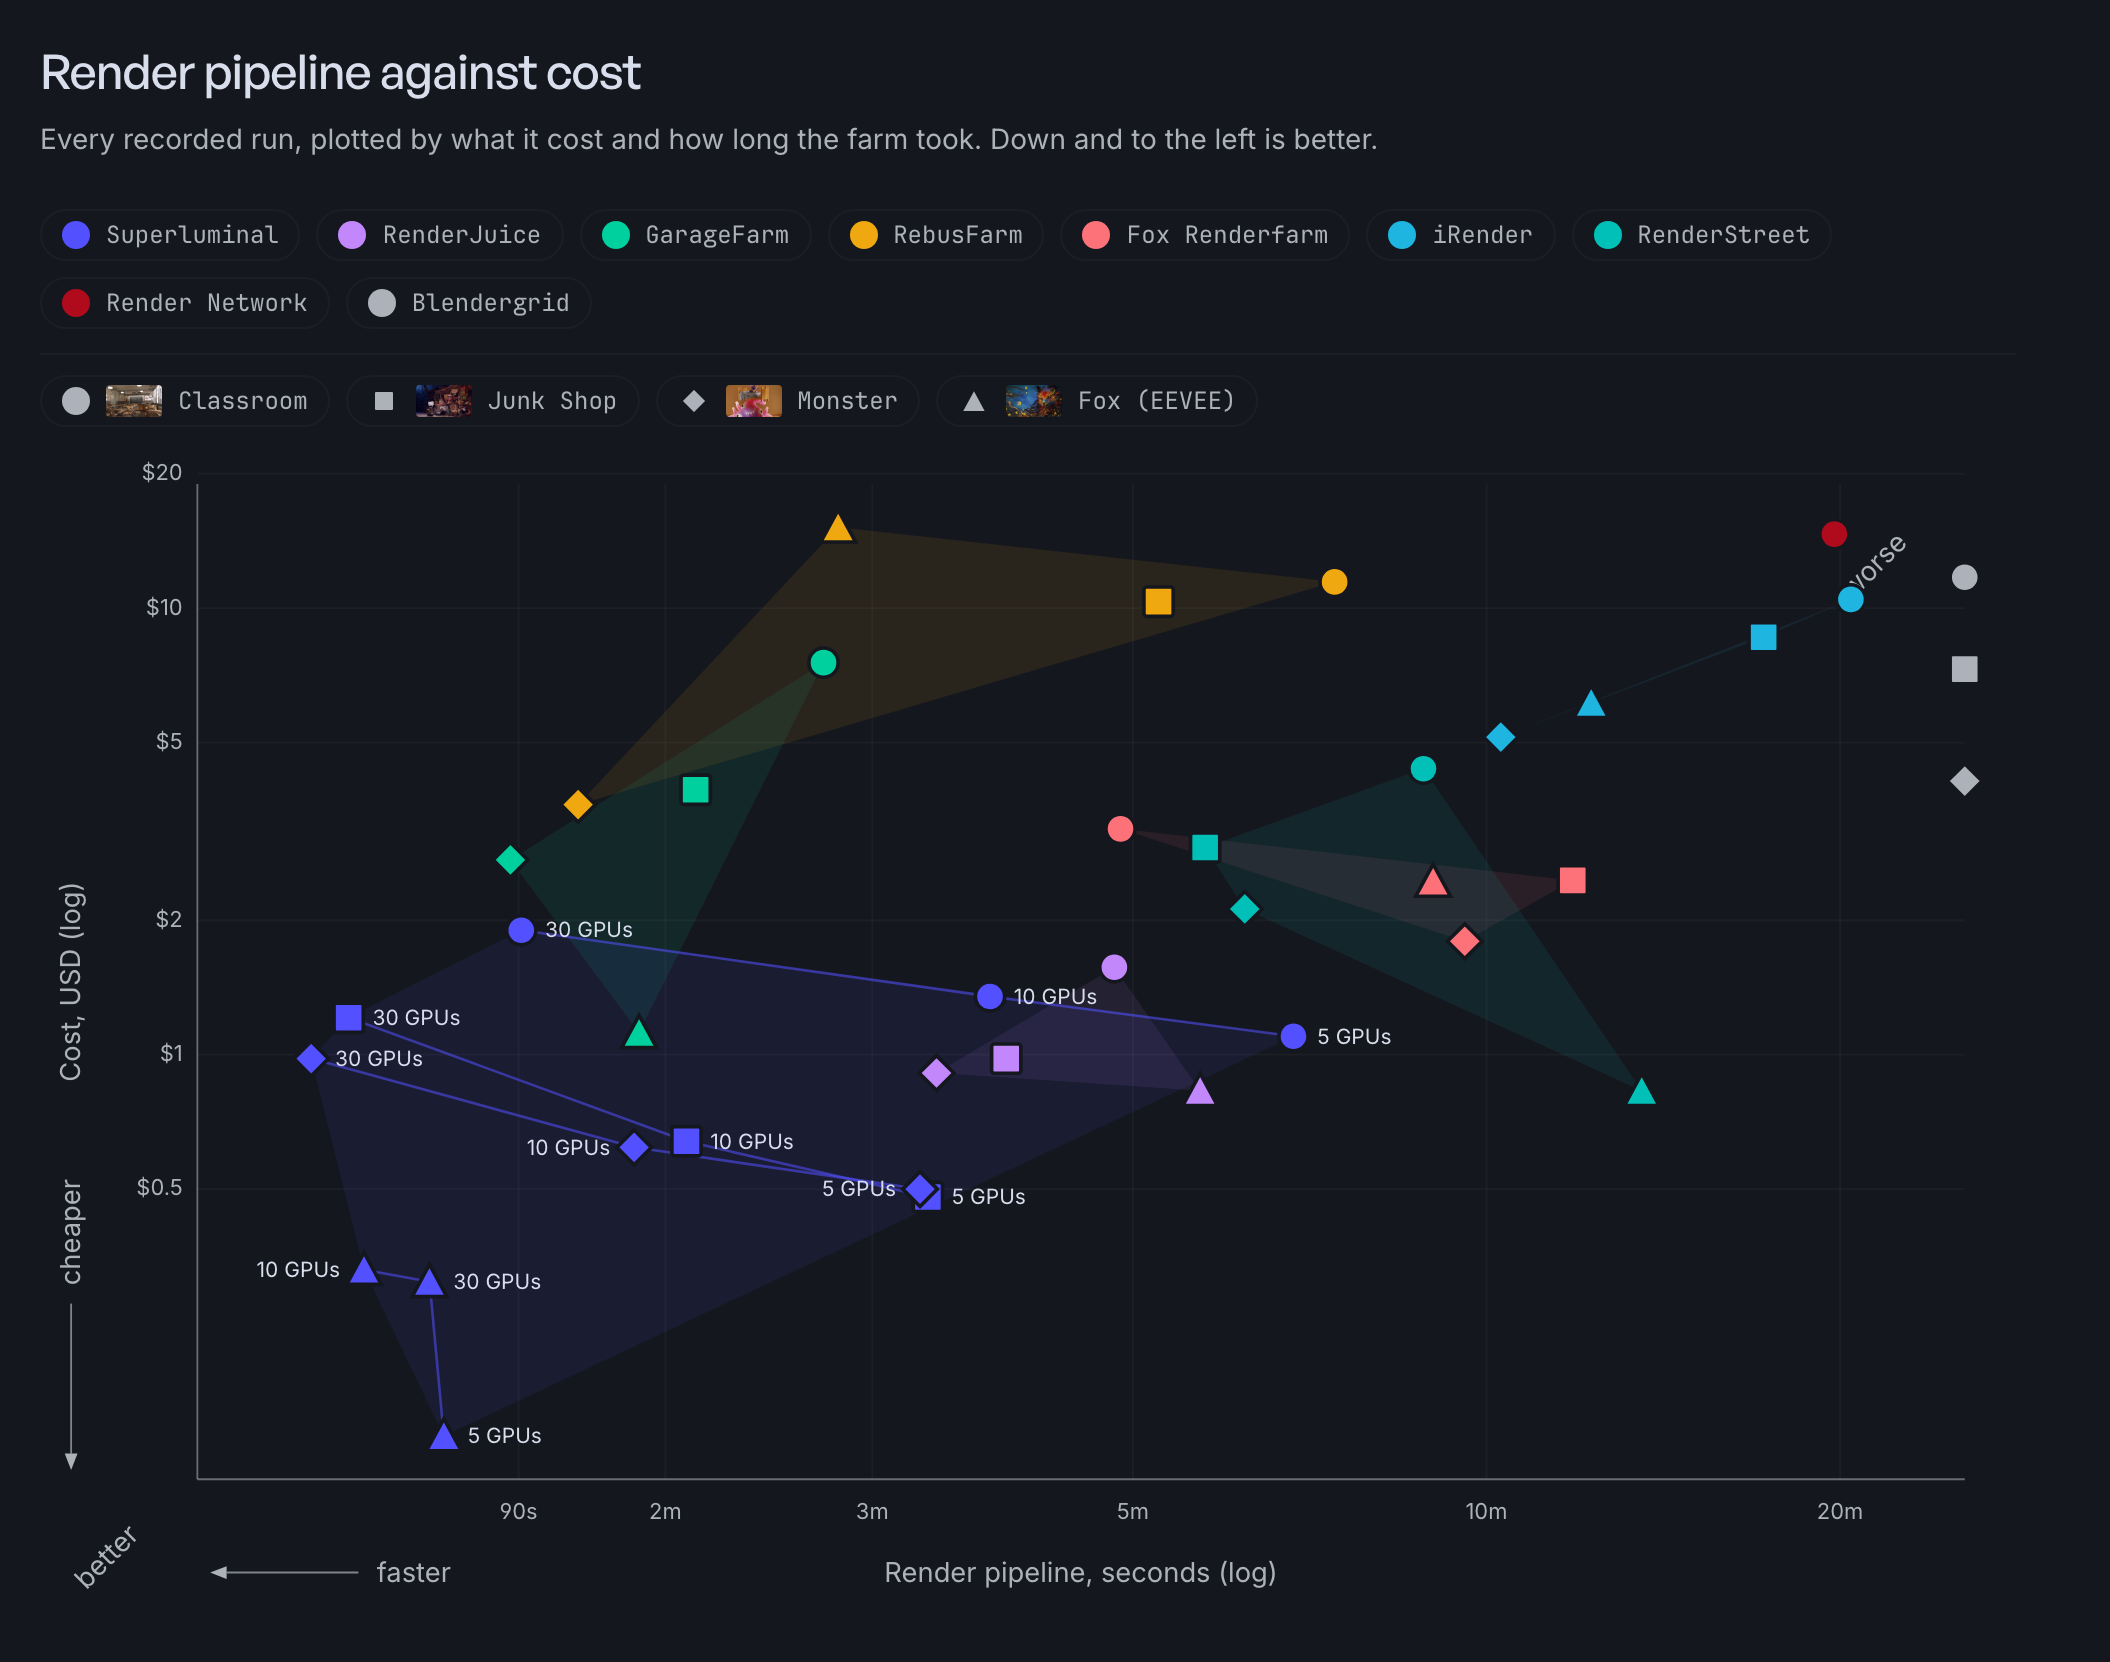
Superluminal recorded the shortest render pipeline on all four scenes. Its leads over the next service were 73.1, 62.8, 28.6, and 14.1 seconds.
Its capacity control behaved as promised. Five nodes were cheapest in every scene. Thirty were fastest on the three Cycles scenes, ten on Fox. The price is visible before you commit.
Seven of the nine services completed all four scenes. Blendergrid completed three, because Blendergrid supports only Cycles. Two paid Render Network attempts on Junk Shop returned no output. The other 41 runs finished.
Render pipeline against cost
One point per recorded run. Down and to the left is better.
One score per farm
Forty-three runs are too many to hold in your head. So each service gets two numbers, a Speed Score and a Cost Score, built in three steps.
Every result becomes a ratio
Raw seconds cannot be averaged across scenes. Classroom renders 145 frames and Junk Shop costs more, so the biggest scene would decide the ranking alone.
Each scene instead has a fixed midpoint: its median result, locked before any scoring. Every run is divided against its own scene's midpoint. Twice as fast as the midpoint is a time ratio of 2. Half the midpoint's cost is a price ratio of 2. Bigger is better on both.
For provider $p$ and scene $s$, with time $T$ and cost $C$:
$ r^{T}_{p,s} = \frac{T_{\mathrm{ref},s}}{T_{p,s}} \qquad\qquad r^{C}_{p,s} = \frac{C_{\mathrm{ref},s}}{C_{p,s}} $
Four ratios combine into one
A ratio of 2 means the same thing in every scene, so the four combine with the geometric mean: multiply, then take the fourth root. One spectacular scene cannot carry a weak farm.
The ratio lands on a 100 scale
A square root compresses the spread so scores stay readable. It never changes which farm is ahead. 100 means the farm matches the midpoints. To read a score, square it: 141.4 means twice as good, 70.7 twice as bad.
$ \bar r=\left(\prod_{s=1}^{n}r_s\right)^{1/n} \qquad\qquad S(\bar r)=100\sqrt{\bar r} $
The Speed Score and the Cost Score each run through the same steps on their own ratios:
$ \mathrm{Speed\ Score}_{p}=S\!\left(\left(\prod_{s=1}^{n}r^{T}_{p,s}\right)^{\!1/n}\right) \qquad\qquad \mathrm{Cost\ Score}_{p}=S\!\left(\left(\prod_{s=1}^{n}r^{C}_{p,s}\right)^{\!1/n}\right) $
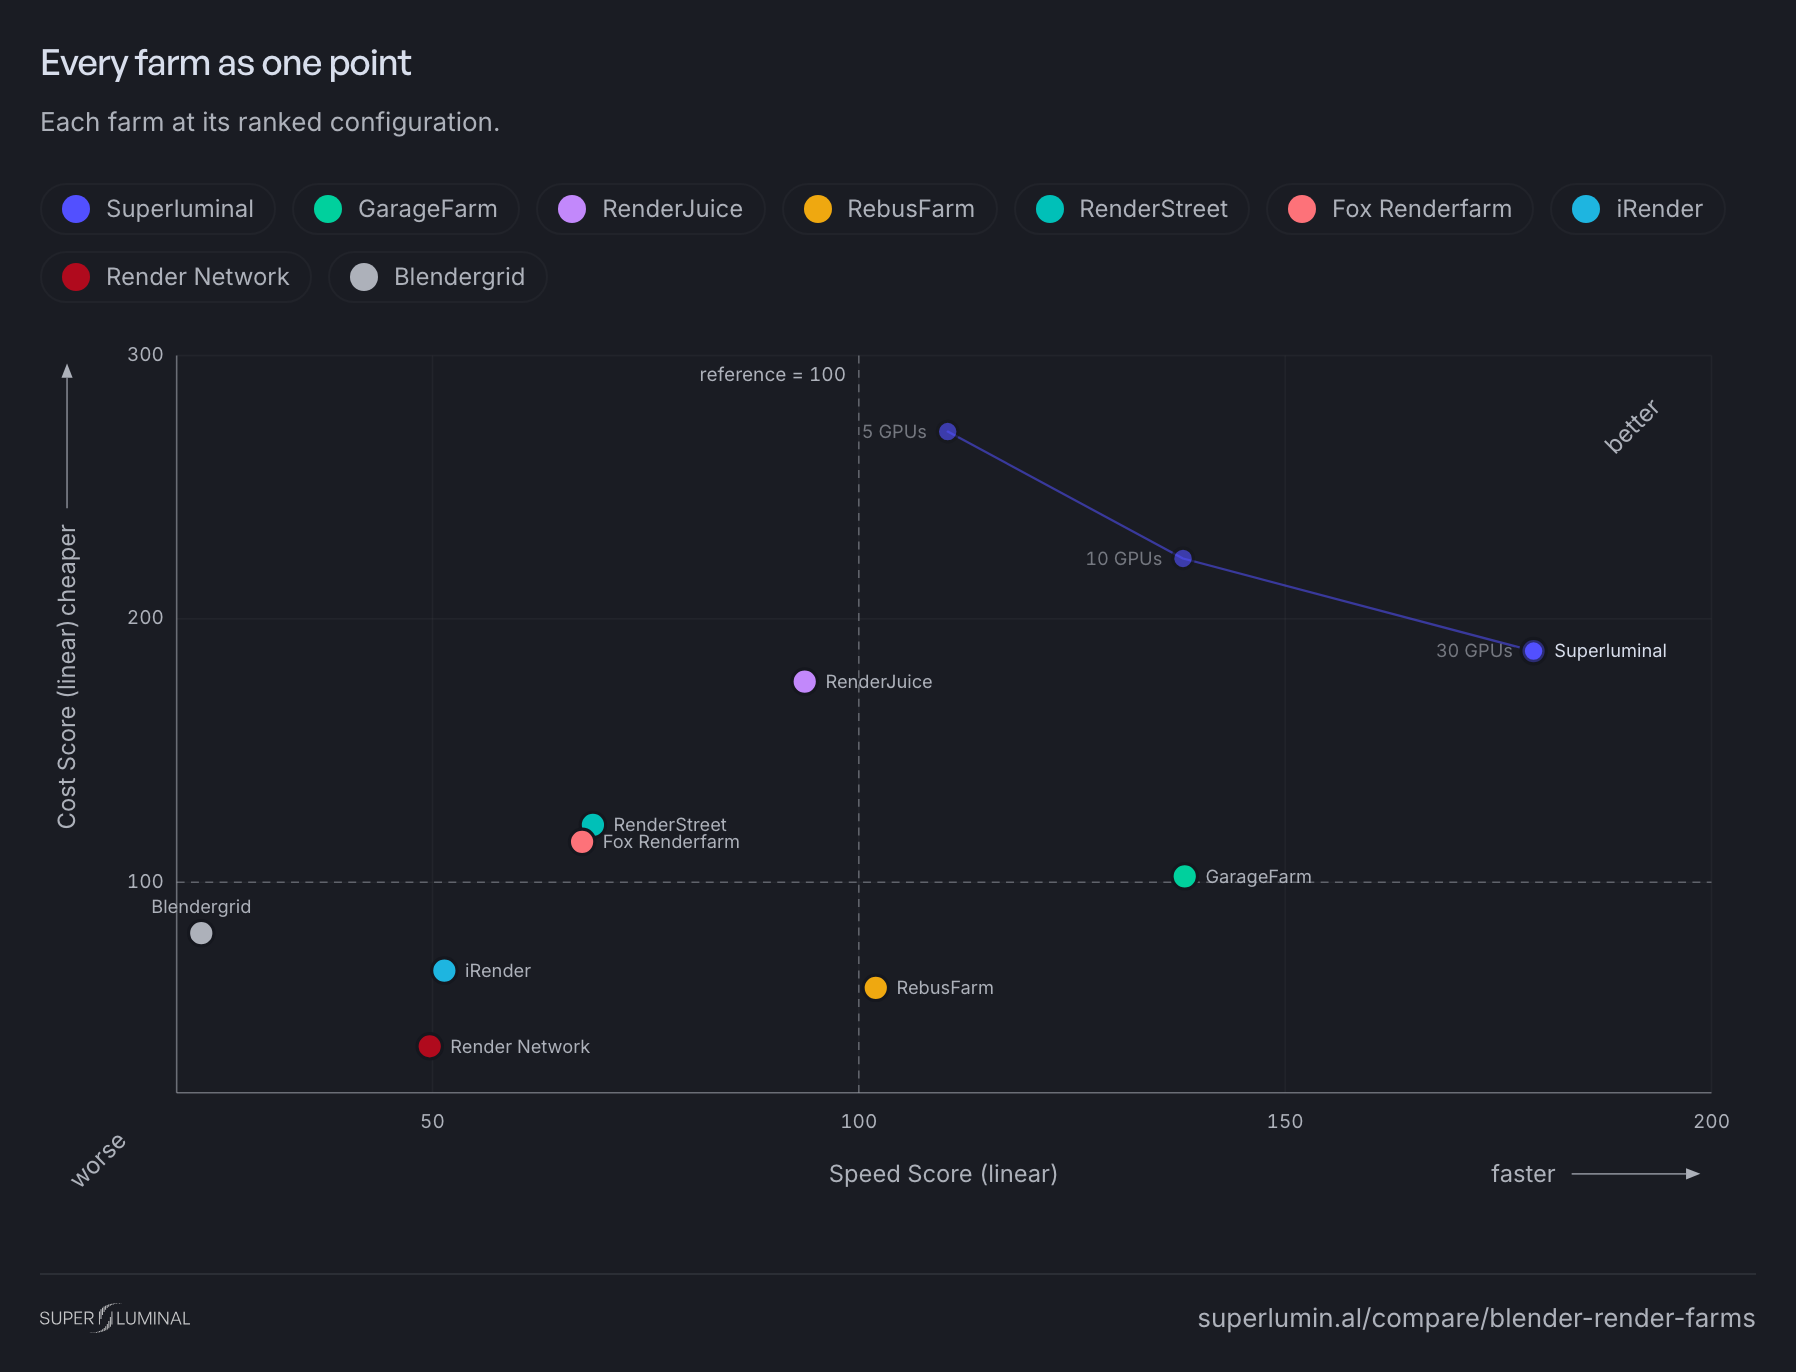
Those two numbers place each farm at one coordinate. Up and to the right is better. A farm tested at several configurations scores each one separately, and its best complete configuration stands for it in the ranking. One configuration's speed is never paired with another's price.
You pay a farm to stop waiting, so the Overall Score counts speed twice and cost once:
$ \mathrm{Overall}_{p} = \frac{2\,\mathrm{Speed\ Score}_{p}+\mathrm{Cost\ Score}_{p}}{3} $
The cost chart plots the 40 finished runs that carry a dollar figure. The one subscription run stays out. A flat monthly fee gives a single job no honest price.
Superluminal and GarageFarm land above 100 on both axes. Superluminal's ranked 30-node configuration scores 179.1 on speed and 187.8 on cost. Squared, that is 3.2 times faster and 3.5 times cheaper than the midpoints.
RenderJuice scores 93.7 on speed and 176.2 on cost. RenderStreet scores 68.8 and 121.7. Blendergrid scores 22.9 and 80.6 on its three scenes.
Every farm as one point
Each farm at its ranked configuration.
The official ranking
A score of 100 matches the reference. A skipped scene stays visible as a gap instead of costing points. A failed render earns no time, and any attempt that still charged money counts against its cost.
Overall Score by farm
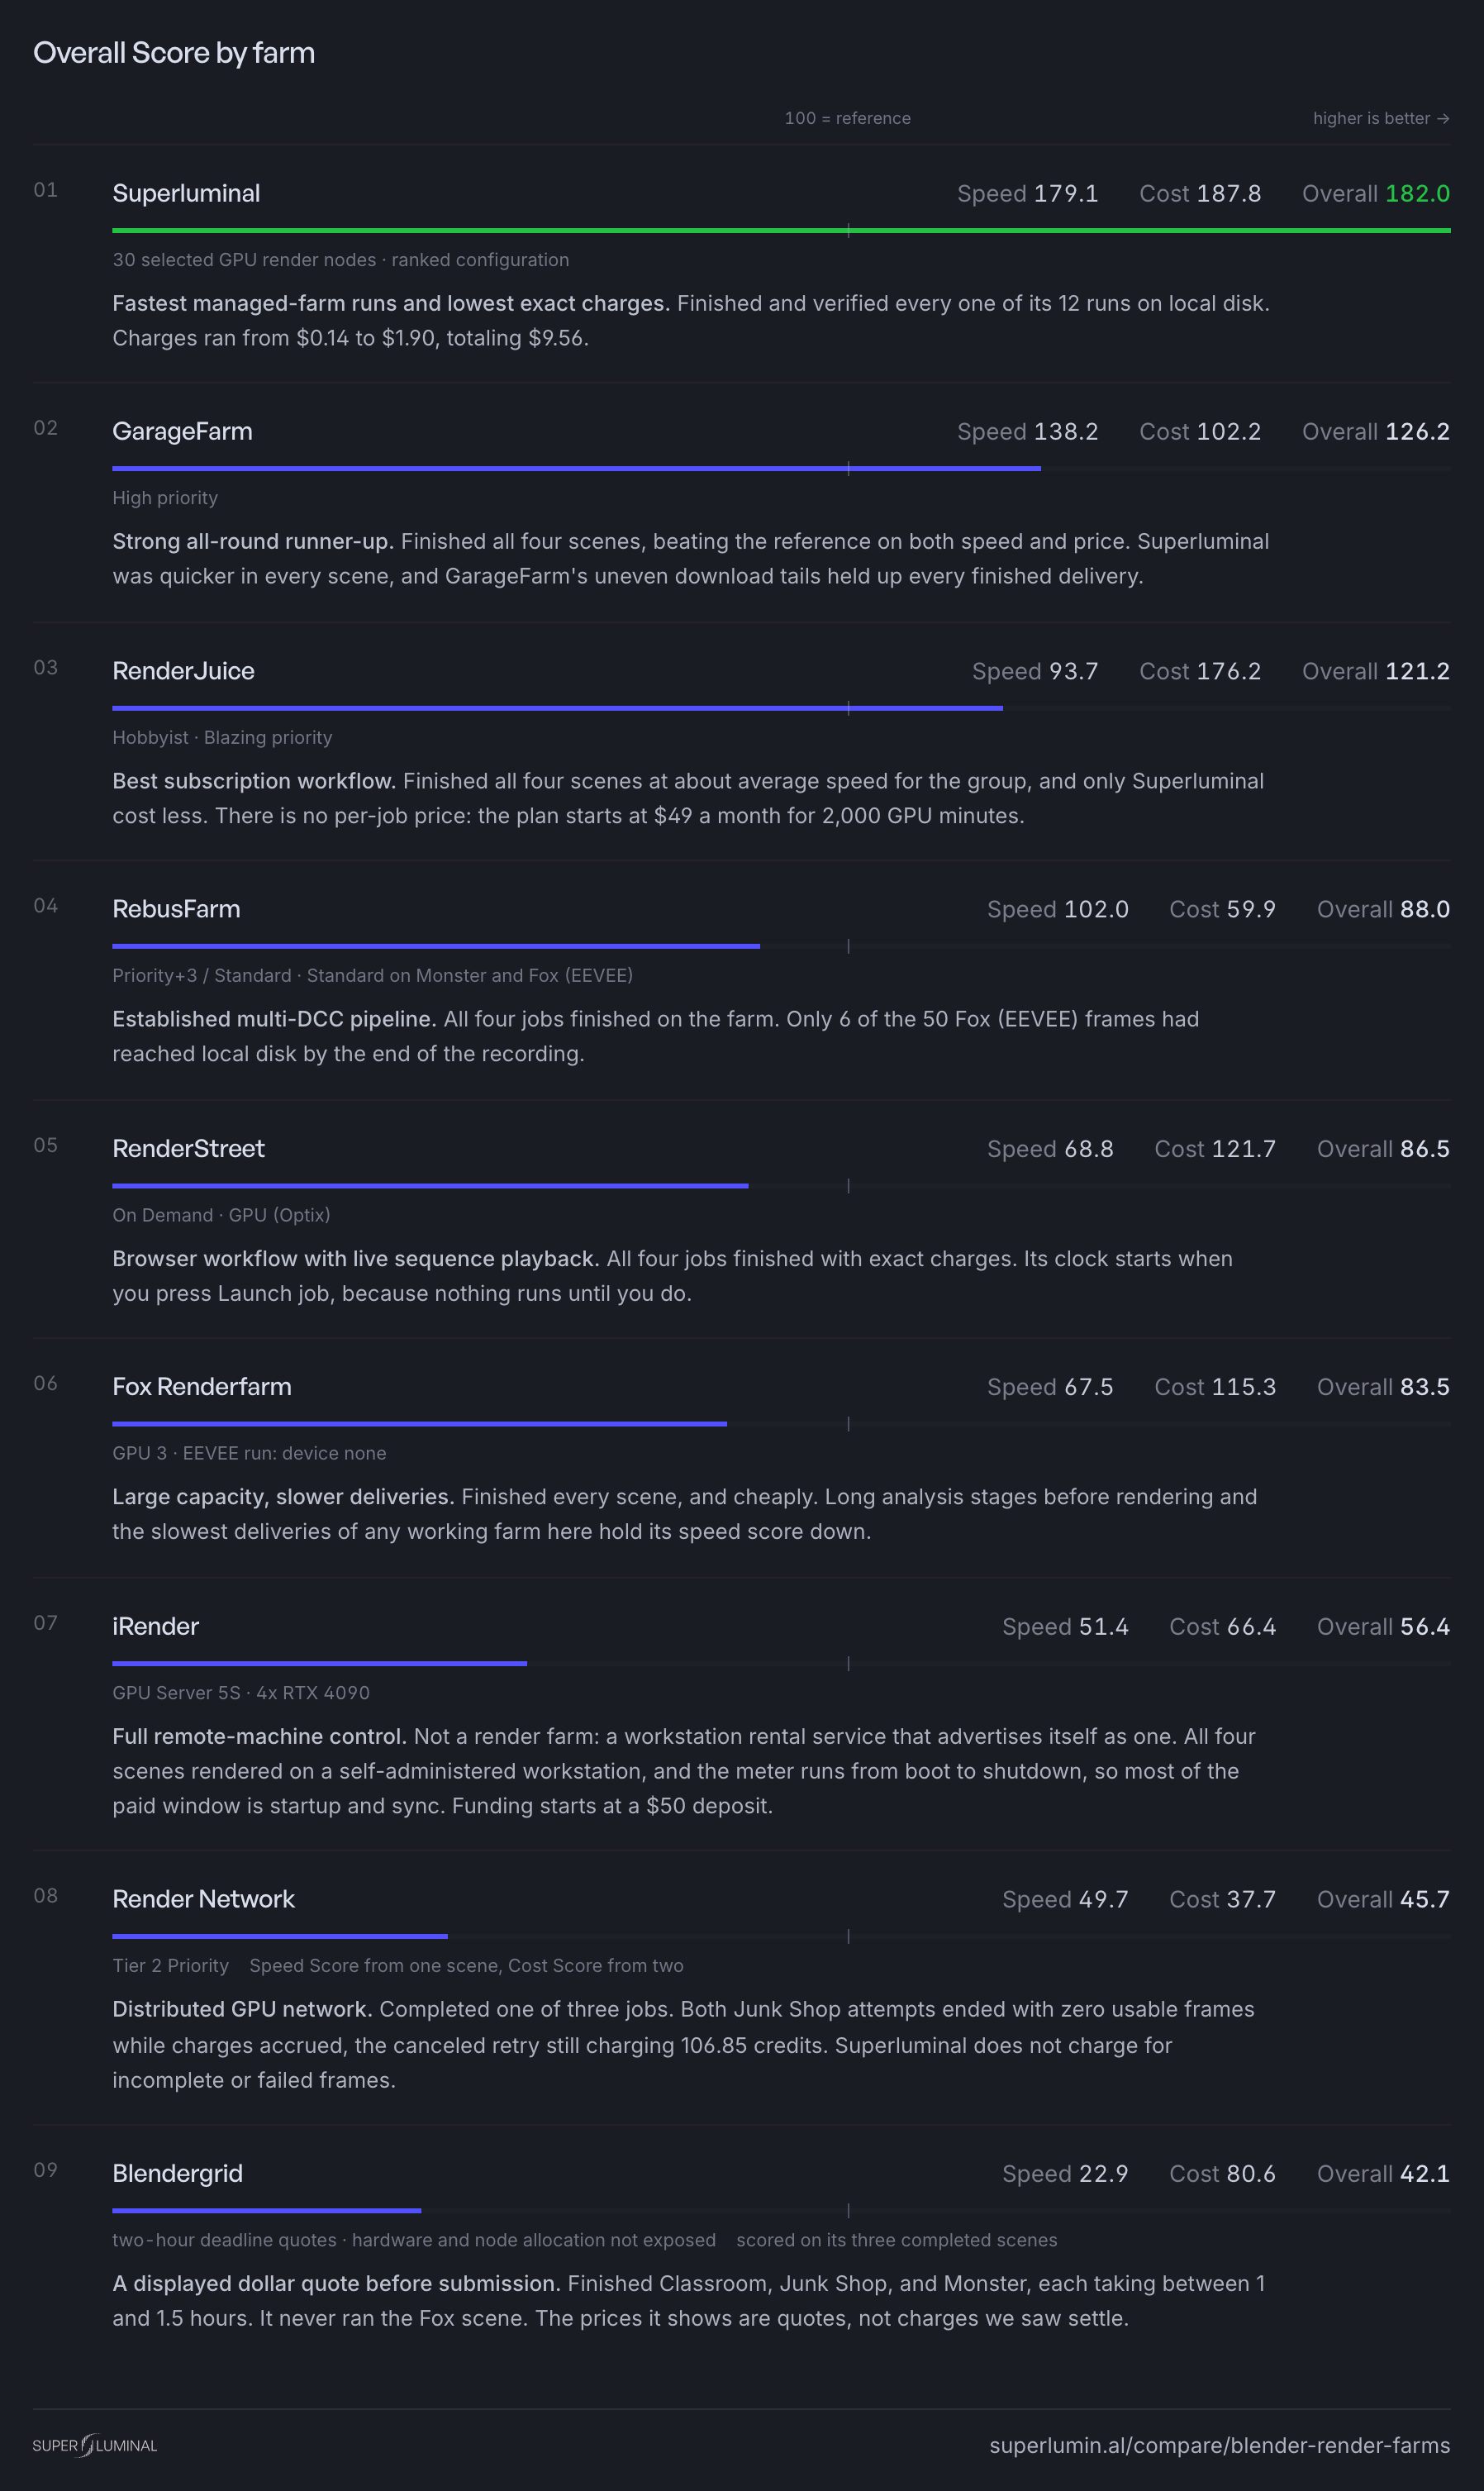
Superluminal's margin comes from low exact charges and fast render pipelines at all three capacities. It has no separate analysis stage and downloads frames while the job runs. Provider completion to local output took 4.1 to 150.9 seconds across its 12 runs. Retrieval does not enter the score.
Node count
Node count matters less than advertised. Fox Renderfarm showed 129 running nodes on Classroom and needed 292.8 seconds. Ten Superluminal nodes finished the same phase in 226.7.
Speed Score against observed nodes
Peak observed machines, not advertised capacity.
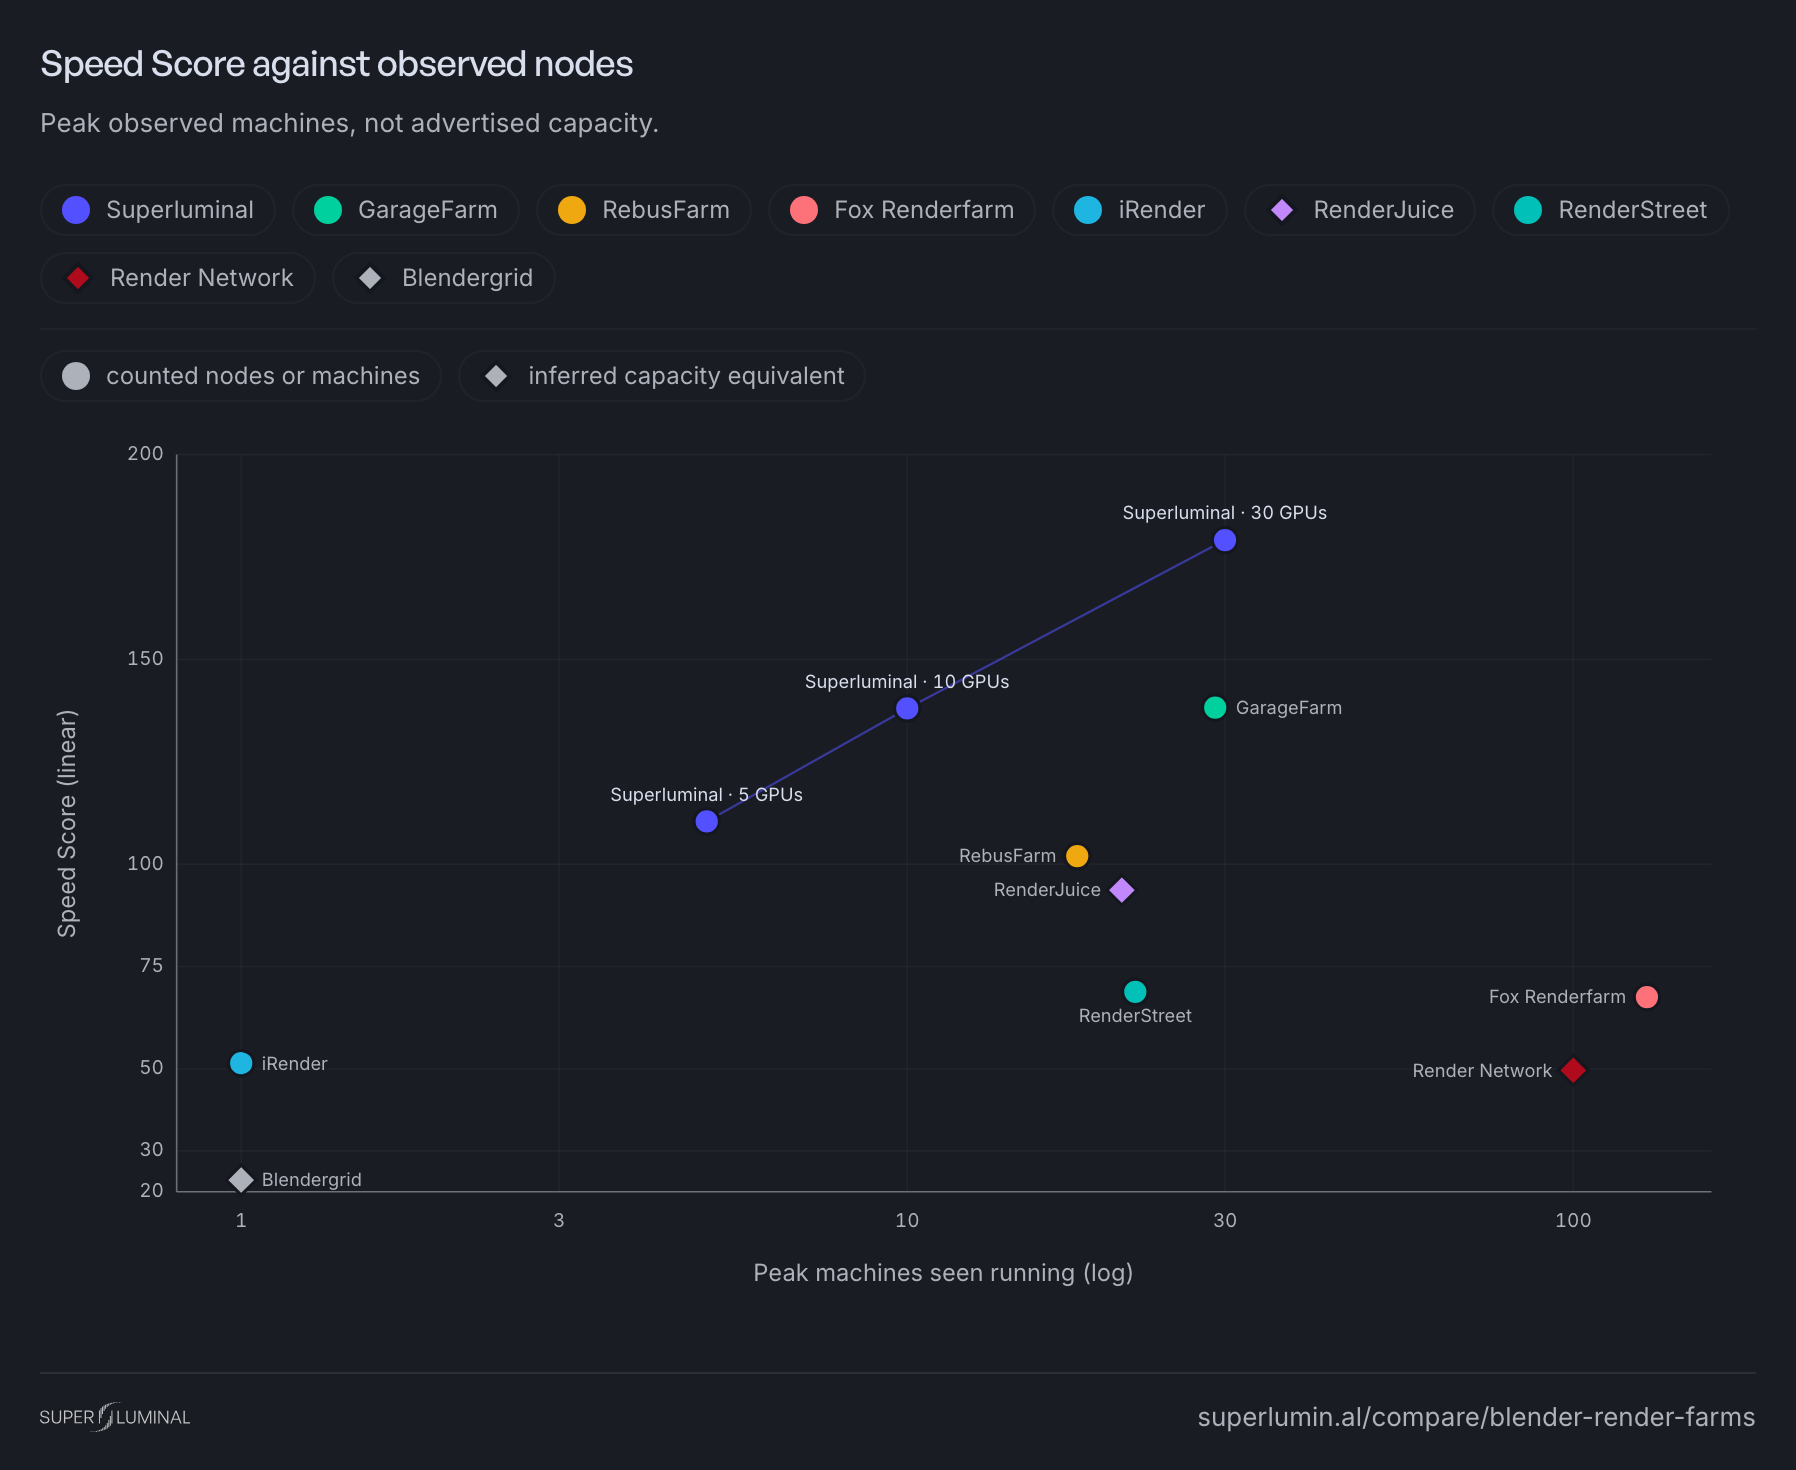
What each farm advertises against what its own interface showed:
| Render farm | Advertised nodes | Observed peak |
|---|---|---|
| Fox Renderfarm | not stated | 129 |
| Render Network | not stated | 100 frames in progress |
| Superluminal | chosen by node count | 5 / 10 / 30, as selected |
| GarageFarm | up to 60 on High | 29 |
| RenderJuice | speed of 30x RTX 3090 | about 21 equivalents, inferred |
| RenderStreet | not stated | 22 |
| RebusFarm | not stated | 18 |
| iRender | one workstation, chosen | 1, with 4 GPUs |
| Blendergrid | not stated | 1, inferred |
Fixed work limits scaling. Going from 5 to 30 Superluminal nodes on Classroom cut the render pipeline from 411.0 to 90.5 seconds. Six times the capacity bought a 4.5-fold gain, at a higher charge.
Upload time
Every farm received the same packages over the same connection. What separates them is client engineering. Browser uploads push one stream and stall when latency rises. The Superluminal add-on splits the package across parallel chunks and keeps the link saturated. Its range runs highest and widest because a saturated upload tracks the connection minute to minute.
What you upload matters as much as how fast. The add-on traces dependencies before submission: linked libraries, textures, UDIMs, caches, fonts, and HDRIs all travel with the job. Anything missing is named on screen instead of quietly dropped. It gave the most complete coverage of any client we tested.
RenderJuice adds a desktop app that cannot submit, one extra round trip per iteration. Render Network expects a file you packed yourself.
| Service | Dependency tracing | Effective upload rate | Submission path |
|---|---|---|---|
| Superluminal | ✓ | 3.2 to 11.4 MB/s | Blender add-on, multithreaded chunks |
| GarageFarm | ✓ | 8.2 MB/s | Desktop client, compresses before sending |
| RenderStreet | ✕ | 3.8 to 5.7 MB/s | Browser upload, then provider scene analysis |
| RenderJuice | ~ | 5.4 MB/s | Browser upload |
| Blendergrid | ✓ | 2.8 to 5.1 MB/s | Browser upload after project selection |
| Fox Renderfarm | ✓ | 3.9 MB/s | Desktop client |
| Render Network | ✕ | 3.5 MB/s | Browser upload |
| RebusFarm | ✓ | 2.1 MB/s | Desktop client |
Effective rate is package size divided by recorded upload time. A range means several recorded runs. GarageFarm exceeds the connection's raw rate because its client compresses first. iRender's Classroom upload predates its recording, so its three later scenes capture upload from first activation.
Download time
Threading helps here too. What matters more is whether frames download while the job is still rendering. A farm that waits for the last frame adds its whole download to your wait.
| Service | Downloads while rendering | Delivery behavior | Time after provider completion |
|---|---|---|---|
| RebusFarm | ✓ | Inconsistent between jobs | 2.2 to 47.1 s |
| Superluminal | ✓ | Multithreaded, streams frames as they finish | 2.4 to 150.9 s |
| Fox Renderfarm | ✓ | Streams frames | 12.9 to 36.4 s |
| GarageFarm | ✓ | Falls behind on larger jobs | 16.2 to 301.3 s |
| RenderJuice | ✕ | ZIP packaged after completion | 17.2 to 41.6 s |
| Blendergrid | ✕ | Browser ZIP after provider finalization | 22.3 to 42.5 s |
| RenderStreet | ✕ | Browser ZIP after completion | 25.0 to 60.3 s |
| Render Network | ✕ | Standalone downloader after completion | 245 s |
| iRender | ✕ | Manual sync | 387.6 to 1,129.5 s |
Streaming services come first, then the shortest observed wait leads each group. This time starts when the farm reports completion and ends when the last frame reaches local disk.
Conclusion
Superluminal won this benchmark. It was fastest on all four scenes, cheapest on all four, and first to put a complete sequence on local disk every time.
The useful finding is why. Node count explains less than you would expect. Fox Renderfarm ran 129 nodes on Classroom and still lost to ten of ours. Speed comes from what wraps the render: how work lands on machines, how fast a node starts producing, and what happens between frames. That engineering is mostly public. The scheduler is not.
Transfers decide the rest. A client that traces every dependency renders correctly on the first attempt. A client that downloads during the render hands you frames before the farm calls itself done. Those two properties moved delivery times more than any hardware difference.
A render you cannot inspect is a render you find out about too late, so we also compared every farm's interface with these same recordings. Superluminal confirmed all eight monitoring features we scored.
Speed, correct files, early frames, and a view of the work are one workflow. We build it as beautiful as we can make it.
Read next:
- How Superluminal is so fast: the engineering behind these times.
- Render farm interfaces compared: every submission surface, side by side.
- Head to head: Superluminal vs GarageFarm, Superluminal vs RenderJuice, Superluminal vs Fox Renderfarm, Superluminal vs RebusFarm, Superluminal vs RenderStreet, Superluminal vs iRender, Superluminal vs Render Network, and Superluminal vs Blendergrid.
Sources
- Render farm benchmark dataset, July to August 2026
- Render farm benchmark run events
- Blender demo files (benchmark scenes)
- Blender Open Data benchmark scenes
- Superluminal Blender add-on documentation
- GarageFarm pricing
- RenderJuice pricing
- RebusFarm Blender support
- Fox Renderfarm Blender workflow
- iRender pricing
- Render Network
- Blendergrid pricing